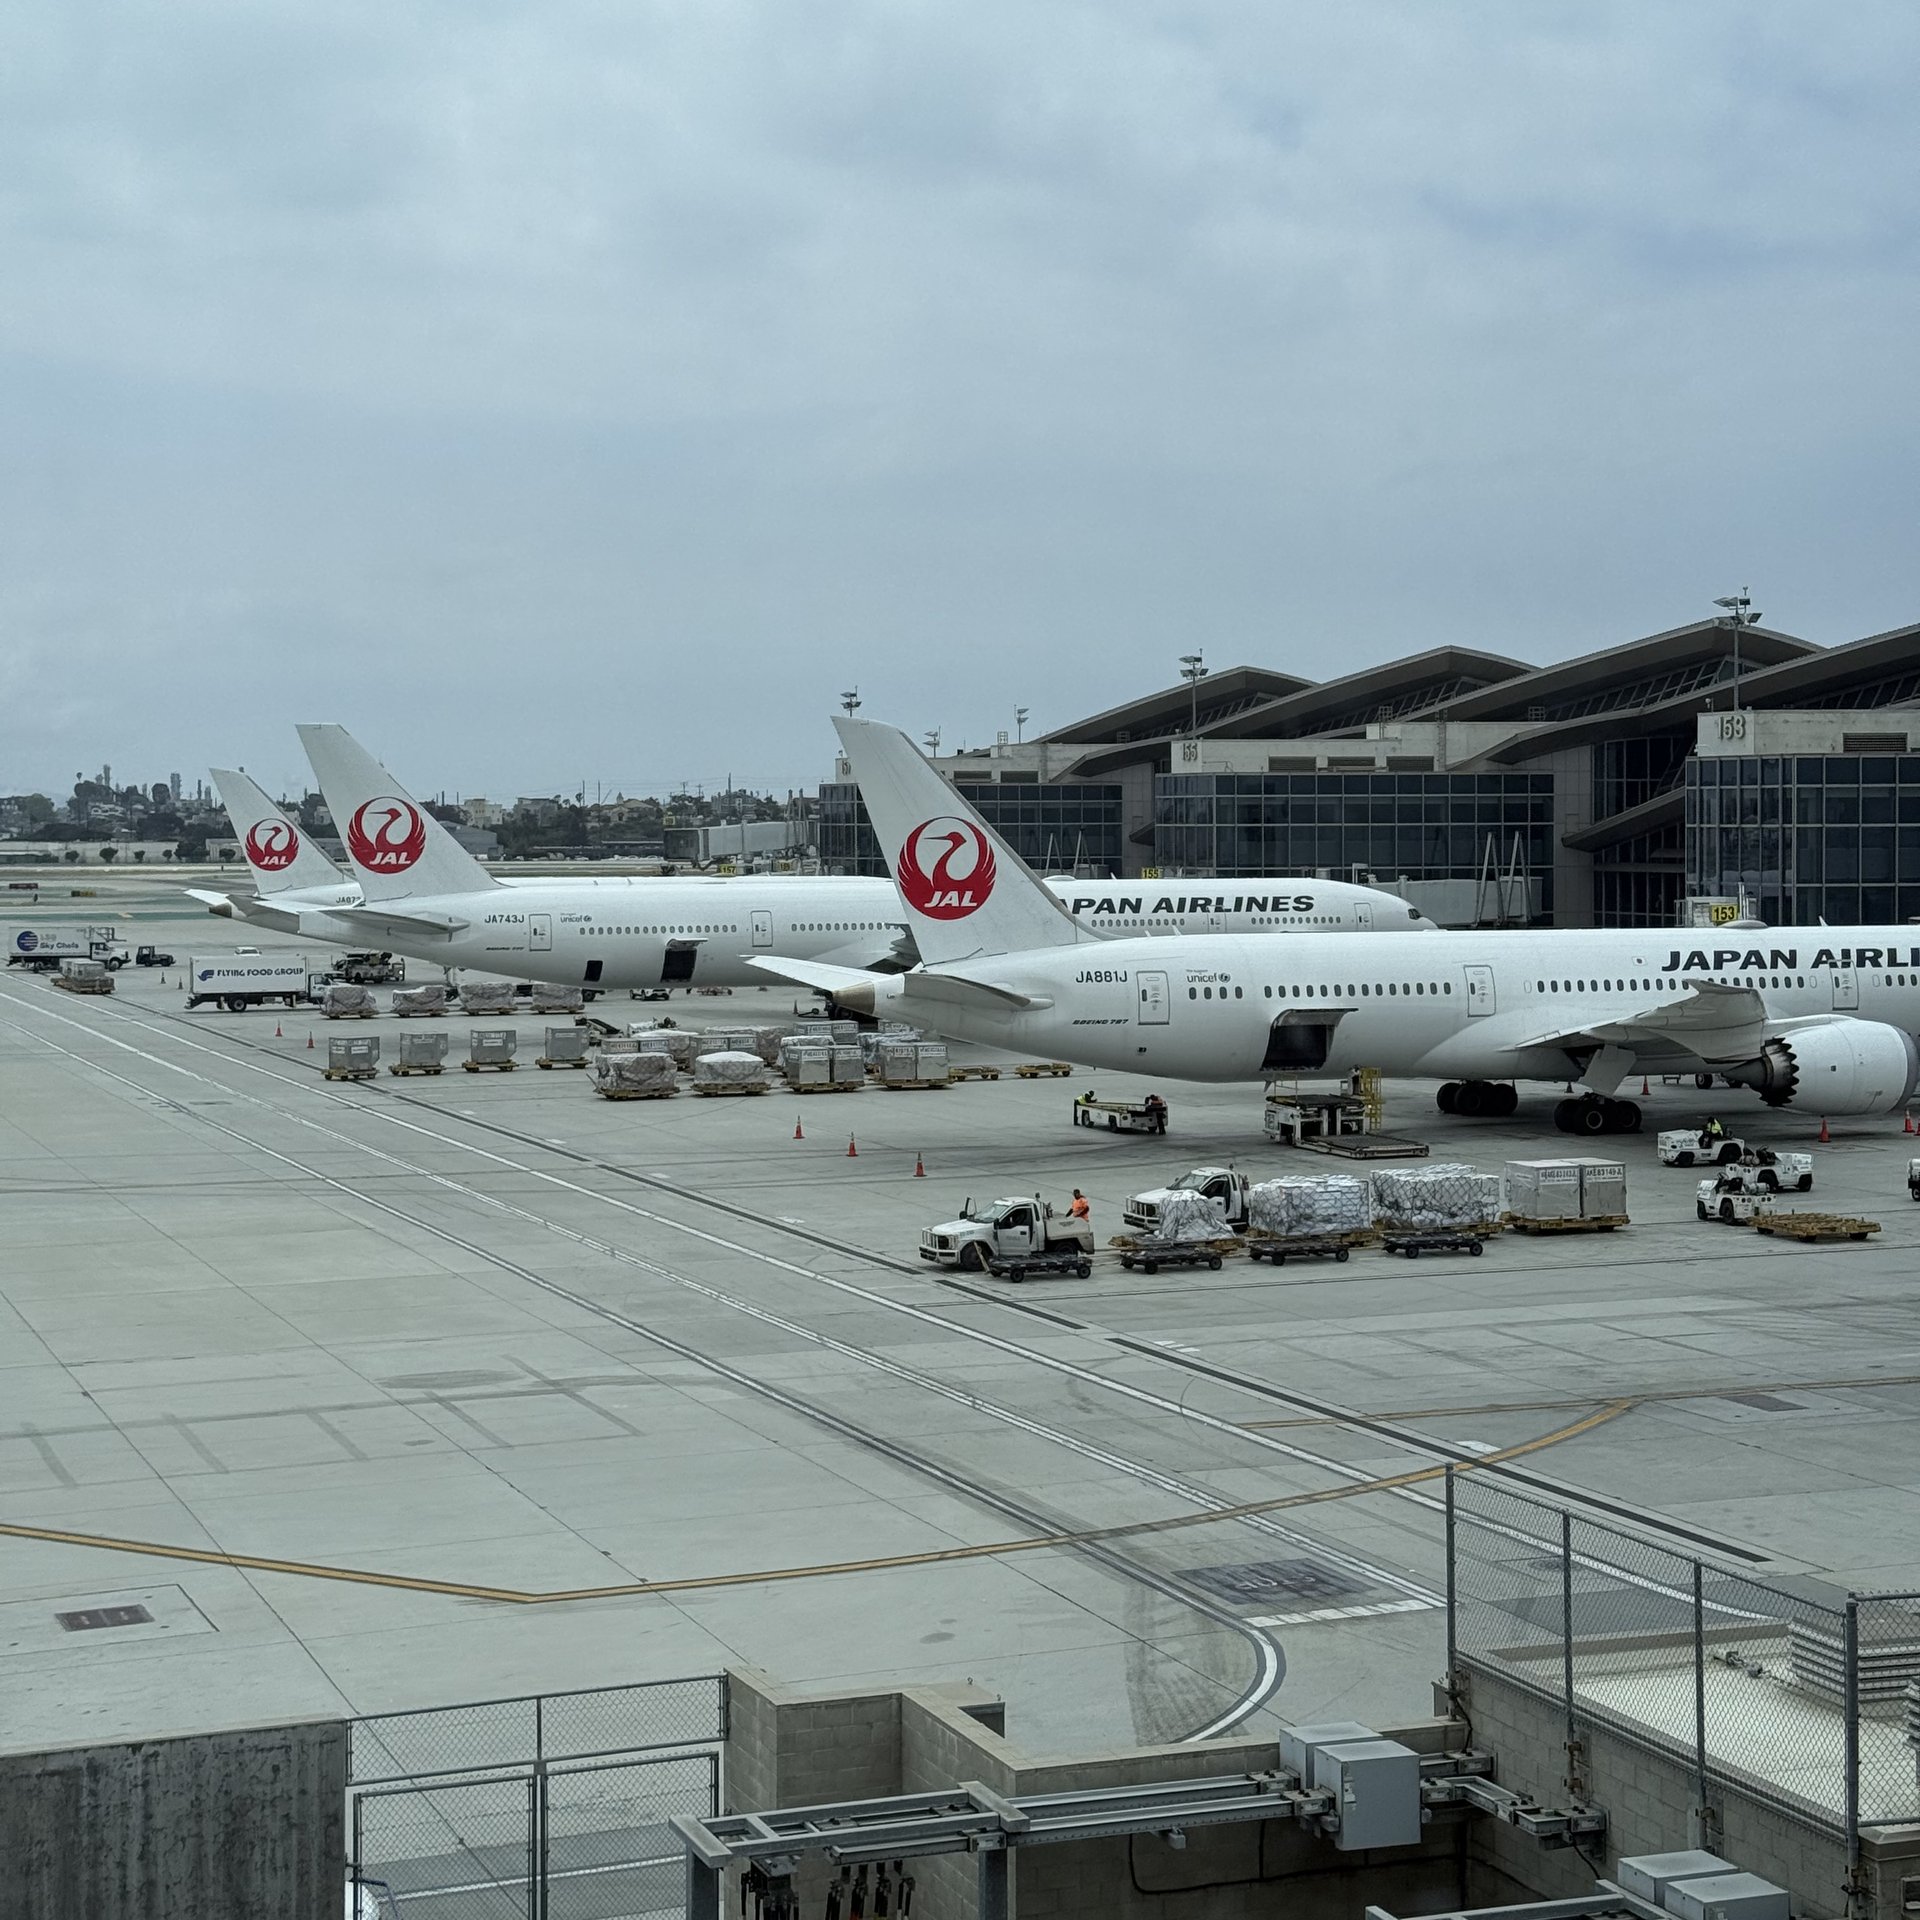
Los Angeles International Airport handled 73,263,431 scheduled passenger arrivals and departures in 2025, according to US Bureau of Transportation Statistics data. That is 13,377,562 fewer than in 2019, a drop of 15.4 percent, and it is the figure behind the standard account that LAX never recovered from the pandemic.
But that headline combines two very different markets. International traffic had returned to 92.7 percent of its 2019 volume by 2025. Domestic traffic was still at 81.2 percent. Of the 13.4 million passenger movements missing from LAX, 11.5 million were domestic.
International traffic has nearly recovered. Domestic has not.
Passengers at LAX each year against that same traffic's 2019 total, set to 100. Both directions, scheduled passenger service.
These figures count passenger movements on individual flight segments, not people. A passenger flying from Denver to Los Angeles contributes one LAX segment endpoint. A passenger flying from Denver through Los Angeles to Sydney contributes two, one arrival and one departure, even if that passenger never leaves the terminal.
The domestic and international recoveries also followed different paths. International traffic fell to about a quarter of its previous volume in 2020, compared with roughly a third for domestic traffic, then increased steadily for four years. Domestic traffic recovered faster at first, stalled for two years and then declined. International traffic’s recovery rate overtook domestic’s in 2024, and the gap widened in 2025.
One country accounts for four-fifths of the international gap
International traffic at LAX declined by 1,869,474 segment passengers between 2019 and 2025. Routes to China accounted for 1,492,443 of that decline, or 79.8 percent. Our interactive of the network across three eras shows where the China routes sat before they went.
China routes carried 2,466,438 passengers in 2019 and 973,995 in 2025, leaving traffic at 39.5 percent of its previous level. Annual traffic on Beijing routes declined by about 478,000 passengers and traffic on Shanghai routes by about 470,000. Guangzhou traffic fell by more than half.
Remove China from the comparison and the international picture changes sharply. The rest of LAX’s network carried 22,592,859 passengers in 2025, compared with 22,969,890 in 2019. The shortfall was just 377,031, on a 2019 base of nearly 23 million, spread across the 46 other countries in the comparison. The international network outside China had recovered to 98.4 percent of its previous volume.
The international losses are concentrated. The gains are dispersed.
Change in passengers between LAX and each country, 2019 against 2025, both directions.
Flight levels between the United States and China remain limited by bilateral agreement, and every major American gateway lost traffic to China. LAX had the largest base to lose: 2.47 million passengers in 2019, nearly twice JFK’s total. Chicago and Houston lost almost all of their China service. LAX retained 39.5 percent of its 2019 China traffic, compared with 24.8 percent at JFK and 31.6 percent at Seattle. Its larger absolute loss therefore appears to reflect its former scale more than a uniquely weak response to the disruption.
Beyond China, the network looks much healthier
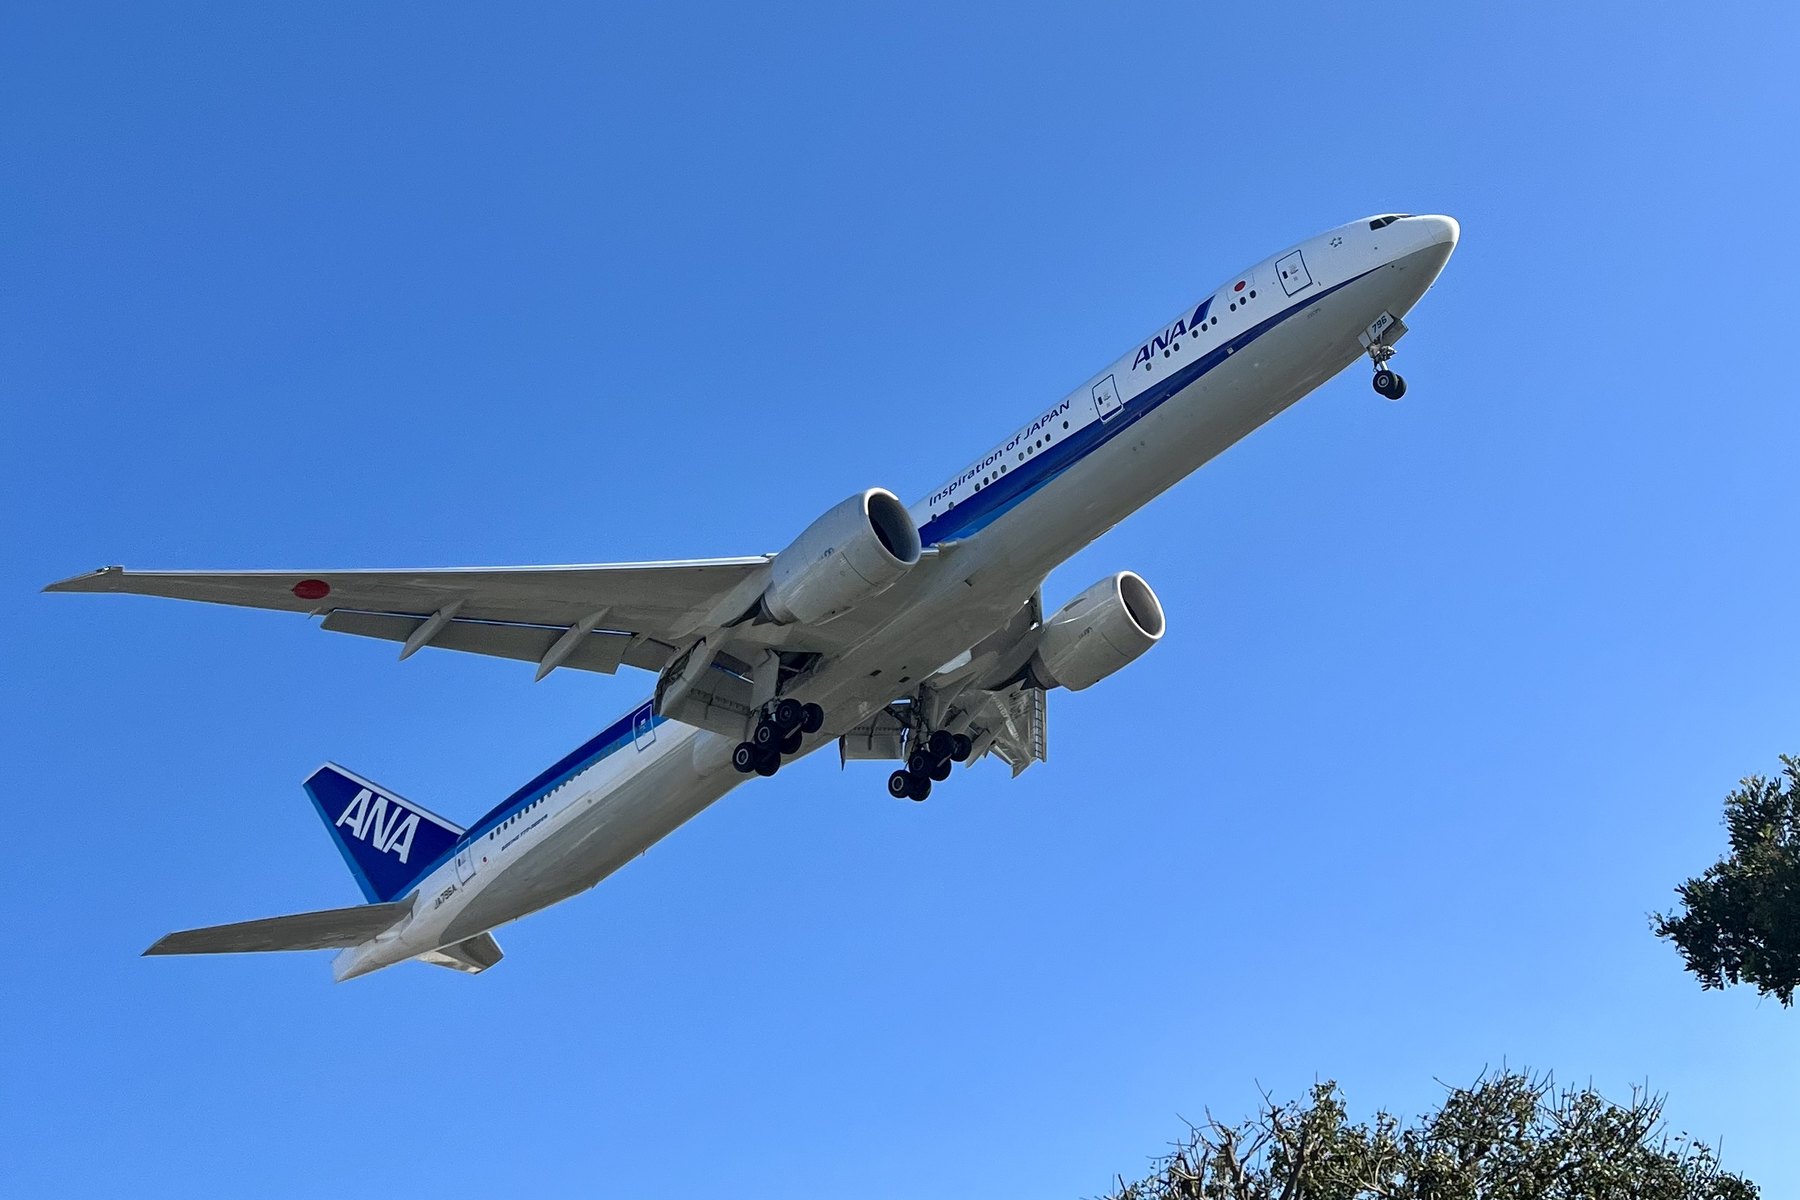
Of the 47 countries included in this comparison, 24 generated more LAX traffic in 2025 than in 2019 and 23 generated less. A week of arrivals and departures gives a sense of what that network looks like on the ground.
Using all markets, the continental totals are mixed. North American traffic was 4.9 percent above 2019. Asia was down 6.8 percent when China was included; without China, Asian traffic was up 16.2 percent. Europe remained 13.7 percent below its previous volume, Oceania 24.7 percent below and South America 29.0 percent below. Africa fell to zero, but from a base of only 4,798 passengers. The international recovery is broad, not uniform.
Asia changes sign once China is taken out
Change in LAX international passengers by continent, 2019 against 2025, both directions and all markets. The hollow bar restates Asia without China; it is not a separate continent.
Tokyo Haneda recorded the largest individual route gain, adding about 598,000 annual passengers. This reflects a shift between Tokyo airports as well as growth in the overall market: Narita lost 142,000 passengers during the same period, while combined traffic to Tokyo increased by about 32 percent. Seoul added 194,000 passengers, Taipei added 155,000 and Singapore’s traffic doubled. The airlines carrying all of it have changed rank repeatedly since 1990.
Tokyo and Seoul gained as Beijing and Shanghai contracted
The eighteen largest international markets at LAX
Hollow dot 2019, solid dot 2025.
Source: BTS T-100 Segment (All Carriers). Both directions, so one round trip counts twice.Outside China, the largest losses were concentrated in Pacific and English-speaking markets. Sydney traffic fell by 209,000 passengers and Melbourne by 347,000, making the combined Australian decline larger than the decline in Canadian traffic. Vancouver was down 184,000 passengers, Toronto 228,000 and London Heathrow, still LAX’s largest international market, 148,000.
Five of the 47 countries had scheduled LAX service in 2019 and none in 2025: Russia, the Cook Islands, Sweden, Argentina and Colombia. Russia’s loss of service followed the war in Ukraine. Sweden’s followed Norwegian Air Shuttle’s withdrawal from long-haul flying and SAS’s subsequent departure from LAX. Colombia is a different case: Avianca left Los Angeles even as total US traffic to Colombia grew by 42 percent over the six-year period.
Three of the 47 appeared in the LAX data in 2025 but not in 2019: Portugal, Greece and the Bahamas.
Domestic traffic is where the larger problem lies
Domestic segment traffic at LAX fell from 61,204,665 passengers in 2019 to 49,696,577 in 2025. The decline of 11,508,088 was more than six times the international shortfall. Most of what is holding down the airport’s total is domestic.
The BTS Origin and Destination Survey separates local passengers from connecting ones. It is a 10 percent sample of tickets, and every record carries the whole itinerary, including each airport where the passenger changed planes. This analysis uses full years from 2000, 2019 and 2024. Where LAX sits in the middle of a routing rather than at either end, that traveler was changing planes, and the survey says so outright, which is better than working it out by subtraction.
In 2019, an estimated 46,912,280 domestic passengers began or ended their journeys at LAX, while 4,258,090 changed planes there. Connecting passengers were 8.32 percent of the combined local-and-connecting total. By 2024 the corresponding figures were 41,806,440 local passengers and 2,751,570 connecting, a share of 6.18 percent. The survey now reaches back to 2000, when the share was 12.41 percent, so this is not a recent turn. LAX has been shedding connecting traffic for a quarter of a century, and what remains of it is increasingly a Hawaii feed: Honolulu, Kona, Lihue and Kahului together supplied a fifth of LAX’s domestic connections in 2000 and a third of them in 2024.
Local passengers account for 59 percent of the domestic decline
LAX domestic segment passengers, split into people whose journey began or ended in Los Angeles and people changing planes. A connecting passenger is counted twice because they arrive and then depart.
The decline included both kinds of passenger, and the local kind accounted for the larger part. Between 2019 and 2024, LAX lost 8,658,984 domestic segment endpoints. Journeys beginning or ending at LAX accounted for 5,105,840 of them, about 59 percent. Connecting passengers fell by 1,506,520, which is 3,013,040 segment endpoints because each connection is counted twice, about 35 percent. The remaining 540,104 cannot be assigned to either side. The survey does not catch every domestic ticket, missing roughly 8 percent of them nationally, and passengers arriving from abroad to continue onward within the United States are absent from it altogether.
Some of LAX’s lost traffic stayed in the region
LAX lost approximately 5.1 million passengers whose domestic journeys began or ended there between 2019 and 2024. Over the same period, the four other large airports in the region gained a combined 2,219,450 local passengers.
Ontario’s local traffic increased by 23.5 percent, Long Beach’s by 12.2 percent, Hollywood Burbank’s by 7.7 percent and John Wayne’s by 1.8 percent. LAX’s fell by 10.9 percent. The aggregate growth at those four airports offset roughly 43 percent of LAX’s local-passenger decline. The data do not track individual travelers, however, so they cannot establish that every additional passenger at a regional airport would otherwise have used LAX.
LAX lost 5.1 million local passengers. The other four airports gained 2.2 million.
Passengers whose journey began or ended at each Southern California airport, 2024, with the change since 2019
Circle area is 2024 traffic.
Source: BTS DB1B, scaled from the 10% ticket sample. Domestic itineraries only. City outline from the LA City boundary file; Ontario is in San Bernardino County and John Wayne in Orange County, which is the point.Using LAX alone as a proxy for the Los Angeles travel market consequently overstates the regional decline in two ways. The airport total includes passengers who were only changing planes, while excluding growth at airports 20 to 50 miles away, including two outside Los Angeles County.
Los Angeles still trails its peers
None of these corrections makes the regional weakness disappear. After adjusting for connections and grouping airports by metropolitan area, Los Angeles still underperformed most large US markets, just by less than the raw LAX total suggests.
Domestic passengers beginning or ending their journeys in the Los Angeles region declined by 4.07 percent between 2019 and 2024, while the national total increased by 4.56 percent. The resulting gap was 8.6 percentage points. Among the 21 largest metropolitan areas by 2019 origin-and-destination volume, Los Angeles had the third-weakest result. Only the Bay Area, down 16.6 percent, and Portland, down 8.1 percent, performed worse. Miami increased by 16.1 percent, Phoenix by 16.9 percent and Orlando by 11.1 percent.
Los Angeles ranks third weakest among the 21 largest metropolitan areas
Change in passengers whose domestic journey began or ended in each metro, 2019 to 2024
The 21 largest by 2019 volume, with multi-airport metros grouped.
Source: BTS DB1B, scaled from the 10% ticket sample. Domestic itineraries of US reporting carriers only, so no international traffic is in this exhibit.The latest decline is mostly a Spirit story
One carrier explains much of LAX’s more recent decline. Spirit carried 3,395,597 LAX passengers in the 12 months ending May 2025 and 1,499,592 in the 12 months ending May 2026. Its reduction of 1,896,005 represented 74.4 percent of the airport’s total trailing-12-month decline of 2,549,116. Excluding Spirit and comparing only carriers that filed data in both years, LAX traffic for January through May 2026 was 3.3 percent higher than in the same period of 2025.
Spirit stopped flying on May 2, 2026, following the company’s collapse stemming from its second bankruptcy in nine months.
Spirit is gone, so its LAX traffic will not reappear. Frontier has already taken up a large share of the capacity Spirit gave up, more than doubling its own LAX volume in 2025. Spirit also cut Los Angeles harder than it cut the rest of its network on the way out, shedding 55.8 percent at LAX against 35.7 percent elsewhere, so the airport absorbed about one and a half times the carrier’s average retrenchment.
What the numbers do and do not measure
The correction for connecting traffic applies only to domestic itineraries. The Origin and Destination Survey covers domestic itineraries reported by US carriers and has no direct international equivalent. A passenger flying from Sydney through Los Angeles to Denver contributes one international segment endpoint and one domestic segment endpoint at LAX but may never visit the city. The international connecting share is material and the survey cannot measure it. Setting LAX’s unexplained traffic against the same figure at airports that carry little international service puts the rate somewhere between 7 and 13 percent of international passengers in 2024, which is a bracket rather than a measurement, and it is narrowing on the same path the domestic share is.
The international figures therefore describe activity on flights serving LAX, not the number of visitors who stayed in Los Angeles. Nor does any passenger count measure hotel stays, restaurant spending, museum visits or other tourism activity. The evidence is strong enough to describe what happened to the airport’s network. It cannot, on its own, settle the broader argument about tourism in Los Angeles.
Data. The accompanying lax-route-history data use passenger and seat figures from the US Bureau of Transportation Statistics T-100 Segment (All Carriers) file. The analysis includes scheduled passenger service only and is restricted to segments with at least one performed departure. Segment figures are directional: LAX totals combine arriving and departing flights, and a round trip contributes two segment records. A segment is classified as domestic or international according to the country at its other endpoint, regardless of the airline’s nationality.
The local-and-connecting figures come from the BTS Origin and Destination Survey (DB1B), scaled from its 10 percent ticket sample. Connections are counted from each ticket’s routing path rather than inferred by subtracting local passengers from the segment total, a method an earlier version of this article used and which overstated them. Country outlines come from Natural Earth and airport coordinates from OurAirports; both sources are in the public domain. Country comparisons exclude markets with fewer than 10,000 passengers in both years. That threshold accounts for the difference between the 47 countries discussed here and the 52 in the raw file. The continental totals include all markets; North America includes Central America and the Caribbean, Turkey is assigned to Asia and Russia to Europe. Metropolitan areas group all of a region’s airports, so Los Angeles is LAX, Burbank, Long Beach, John Wayne and Ontario, and the peer panel is the 21 largest such groupings by 2019 origin-and-destination volume.
Caveats that matter for these numbers. T-100 reporting for 2026 remains incomplete. Air Canada, Emirates, Qatar Airways, Air Premia and several other airlines had not filed some or all months included in the data. Spirit filed every month, and its low May 2026 totals record a carrier that stopped flying on May 2 rather than one that failed to report. Headline comparisons end in 2025 all the same, that being the latest complete year.
The two 2026 comparisons in the Spirit section include only carrier-months with filings in both periods, and Spirit is set aside separately because it ceased operating, not because of a filing gap. Across all carriers, the raw January-through-May change was negative 2.35 percent; after matching carriers with filings in both periods, it was positive 0.5 percent. Excluding Spirit from the matched comparison produced the 3.3 percent increase reported above.
The Origin and Destination Survey lags T-100 by about a year and currently extends through the second quarter of 2025. For consistency, the local-and-connecting comparison uses full-year data from 2019 and 2024. All passenger totals represent segment activity or estimated journeys, not unique people, and a country’s flag identifies the destination or origin of the aircraft rather than a passenger’s residence or nationality.