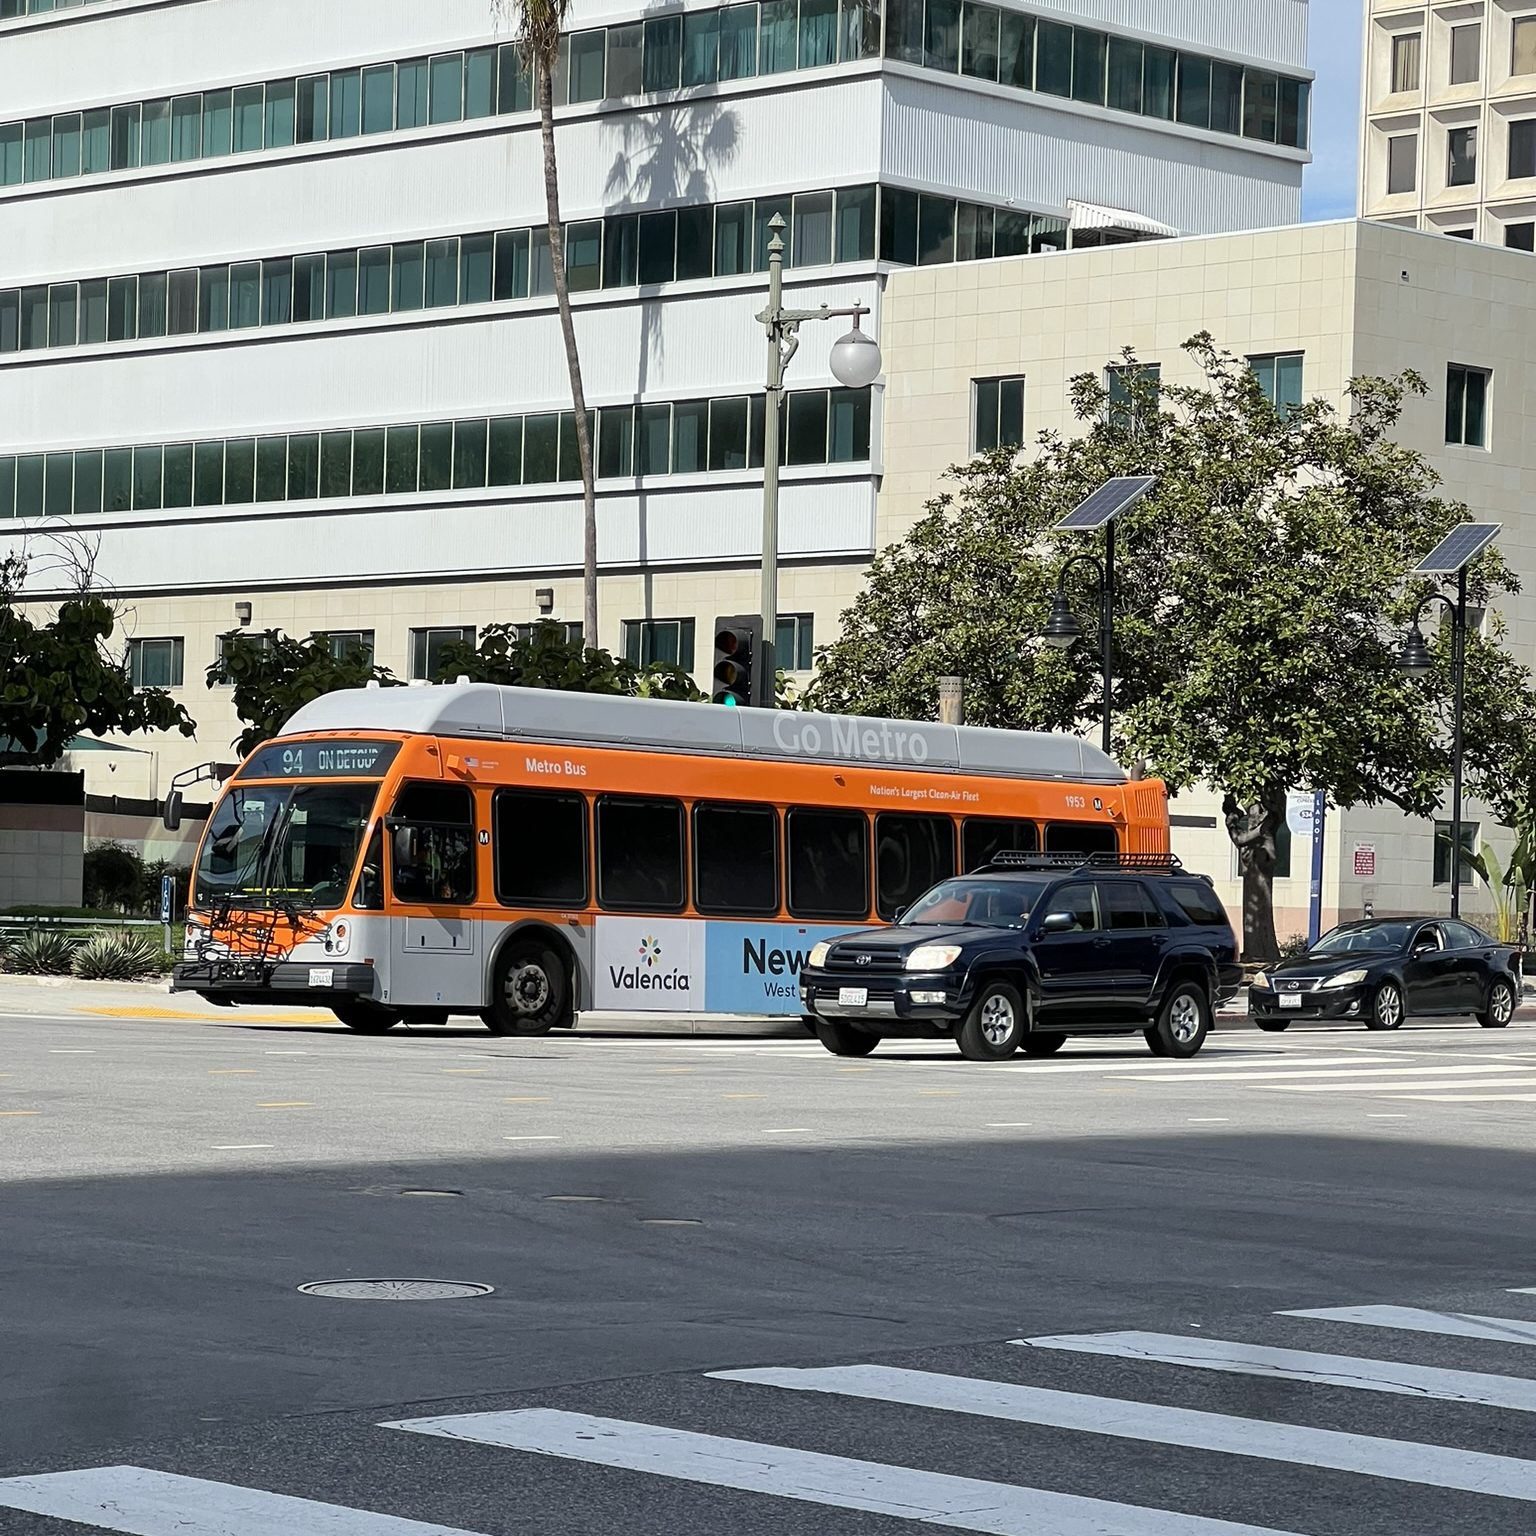
Los Angeles has spent decades and tens of billions of dollars building a rail network, and 16.0% of the city’s residents live within a half mile of a station. Count the two busways, the G Line across the Valley and the J Line down the Harbor Transitway, and it reaches 22.1%. The rest of the city, more than three million people, lives further than a ten minute walk from any Metro rail station or busway stop.
Rail access is concentrated rather than thin everywhere, and five of the fifteen council districts have none of it.
The five
Council Districts 3, 4, 6, 7 and 12 contain zero Metro rail stations. All five are in the San Fernando Valley. Together they hold 1,290,946 residents, which is 33.5% of the city.
Every figure in this piece counts Metro service only, from Metro’s own published schedules. Metrolink commuter rail, which does run through parts of the Valley, is not included, so a district with no Metro rail station is not necessarily a district with no train.
| District | Member | Rail stations | Busway stops | Residents within a half mile of rail |
|---|---|---|---|---|
| 3 | Bob Blumenfield | 0 | 16 | 0.0% |
| 4 | Nithya Raman | 0 | 2 | 6.4% |
| 6 | Imelda Padilla | 0 | 7 | 0.0% |
| 7 | Monica Rodriguez | 0 | 0 | 0.0% |
| 12 | John Lee | 0 | 2 | 0.0% |
Five districts, a third of the city, with no Metro rail station
Metro rail stations inside each council district. The five with none are all in the San Fernando Valley and hold 1,290,946 people between them.
District 4 shows 6.4% because its southern edge sits close enough to stations in neighboring districts for some of its residents to walk to one. The other four are at zero.
District 7 is the only district in Los Angeles with no rail station and no busway stop. Its 252,710 residents have nothing within a half mile but buses. It has 407 bus stops, and its bus service works out to 91.5 weekday departures for every 1,000 residents, which is among the lowest in the city.
Downtown has a third of the trains
At the other end, Council District 14, which contains downtown, has 13 rail stations and 5,488 weekday rail departures. That is 34.8% of every rail departure inside the city limits, serving a district with 6.9% of the city’s population. It is more than the next two districts combined, District 10 with 2,128 departures and District 1 with 1,612.
Downtown is where the lines cross, and its stations serve transferring passengers as well as nearby residents.
The bus numbers are harder to explain that way. Bus service ranges from 371.5 weekday departures per 1,000 residents in District 14 down to 54.1 in District 11, a spread of nearly seven to one, and buses are the part of the system that is supposed to reach where the trains do not. Four of the five districts with no rail also sit in the bottom half for bus service per resident.
Bus coverage is broad and uneven
The one measure on which Los Angeles looks like a transit city is bus proximity. 77.5% of residents live within a quarter mile of a Metro bus stop, and in six districts it is above 90%. District 9 reaches 97.7%, District 8 is at 96.3%, District 10 at 95.1%.
Those are the districts with almost no park land, and they are also the districts where the bus network is densest. Both facts come from the same history: they were built dense, early and without much left over.
Coverage is not the same as service, though. Being a quarter mile from a stop tells you a bus route passes nearby, not that a bus comes often enough to plan a day around, and this data cannot tell you the difference between a stop served every eight minutes and one served every fifty. Departure counts per resident are the closest available proxy, and they say the gap between the best and worst served districts is much larger than the coverage figures suggest.
Method
Stations, stops and scheduled service come from LA Metro’s published GTFS feeds for rail and bus, joined to the 2021 council district boundaries. Population is ACS 2020-2024 tract population apportioned to districts by area.
The half-mile and quarter-mile access figures are straight-line distances, computed in a projected coordinate system rather than in raw degrees, which matters at this latitude and is a common way to get these numbers wrong. They are still an upper bound, because a straight line ignores freeways, the river, hills and walls. A walking-network measure would lower every figure here.
“Rail” means Metro rail. It does not include Metrolink, which runs commuter service through several of the five districts named above, or Amtrak, or municipal operators like LADOT’s DASH buses. A district with no Metro rail station is not necessarily a district with no train, and Metrolink is a real if infrequent option in parts of the Valley. What the figure describes is access to the frequent urban rail network that Los Angeles has been building and taxing itself for since 1990.
Weekday departures count scheduled trips serving stops inside each district on a typical weekday, so a station served by two lines counts each line’s service. Stations sitting on a district boundary are assigned by the district their point falls in.