Metro Micro is the agency’s on-demand van service. Riders hail a van through an app and it carries them to another point inside the same zone. Eight zones cover about 181 square miles of Los Angeles County, from Watts to Northwest San Fernando Valley, and the service has been running since December 2020.
In the fiscal year ending June 2024, the most recent year Metro has published a full cost for, Micro carried 762,757 boardings and cost $24,711,171 to operate, about $2.06 million a month. That works out at $32.40 a boarding. Riders covered 1.7 percent of it.
The same year, a boarding on an ordinary Metro bus cost $6.42.
What one boarding costs Metro, by mode
Operating cost per boarding, fiscal year 2024
The two bike share bars are estimates, not reported costs: a 2026 contract run rate over a 2024 trip count. It appears twice because Metro pays 35 percent and the city pays 65.
Source: LACMTA National Transit Database filings, FY2024, viadata/micro. Bike share derived from Metro board files 2026-0501 and 2023-0616 against 519,237 trips in 2024. Bike share is not an NTD-reportable mode, so no audited cost per trip exists.A Micro ride costs five bus rides
Metro reports every mode it runs to the National Transit Database on the same basis, which makes the comparison a matter of reading one table.
Bus rapid transit is the cheapest thing Metro operates, at $6.27 a boarding. Directly operated bus is $6.42. Heavy rail, the B and D Lines, is $10.79. Light rail is $14.50. Vanpool, which is a very different product, is $7.24.
Micro is $32.40, and it is the most expensive service Metro runs by a factor of five over its own bus.
The gap narrowed sharply after the launch year. FY2024 is the last year Metro has costed, so whether it kept narrowing is not yet answerable from published figures.
The first year ran at $410 a boarding
Micro launched in December 2020 into a shut city. Its first partial year carried 42,104 boardings against $17.3 million in operating expense, which is $410.58 a boarding.
Metro Micro cost per boarding, by fiscal year
Operating cost per boarding
FY2021 covers seven months of a service launched into a shut city. Metro has published boardings for FY2025 and FY2026 but not a comparable operating expense.
Source: LACMTA National Transit Database filings and Metro board reports, viadata/micro/clean/micro_fiscal_year.csv.Costs fell steeply after that. FY2022 came in at $49.82, barely moved to $47.62 in FY2023, then fell by a third to $32.40 in FY2024. Metro has published boardings for FY2025 and FY2026, 671,844 and 762,381, but not a comparable operating expense for either, so the last two points on that line do not exist yet in public.
Ridership dipped and recovered rather than grew: FY2026 finished within 400 boardings of FY2024, having fallen to 671,844 in between. The service Metro buys did grow: FY2026 ran 222,482 vehicle revenue hours against FY2024’s 196,203, 13.4 percent more, so the monthly cost has probably risen since, though the cost per hour after FY2024 is unpublished.
The vans are not full
Cost per boarding is a function of two things: what an hour of service costs, and how many people ride in that hour. The second is where Micro is unusual.
In FY2024 Micro carried 3.89 boardings per vehicle revenue hour. A Metro bus carried 34.50. Bus rapid transit carried 44.77. Heavy rail carried 80.07.
How many people each mode moves in an hour of service
Boardings per vehicle revenue hour, fiscal year 2024. One hour of one vehicle, in paid service.
data/micro/clean/micro_mode_comparison.csv.A Micro van, in an hour of paid service with a paid driver in it, carries about four boardings. The hourly cost of running a van is the other input, and it is the one a contract renegotiation can reach.
Metro’s own closest comparison is vanpool, at 3.39 boardings a vehicle hour and $7.24 a boarding. Vanpool is nearly as unproductive per hour and costs a quarter as much, and the largest single reason is that its drivers are participants rather than employees.
Metro pays a third of a bike trip
Metro runs a second shared-mobility program, and it does not appear in the National Transit Database at all, because bike share is not a reportable mode. There is no federal filing with an operating cost in it and no cost column in any file Metro publishes about the bikes.
Two board reports carry figures an annual operating cost can be derived from.
Board File 2026-0501, approved in July, authorizes $6,505,955 for up to six one-month extensions of Metro Bike Share, booked to project 308010, Bike Share Program O&M. That is a run rate of $13.0 million a year. Board File 2023-0616, the competitively awarded replacement contract, prices its base five years at $62,933,262, which is $12.6 million a year. The two agree within 3.4 percent.
That run rate is a 2026 figure, and Metro has published no year-by-year operating cost for the bikes at all. Applying it to the 519,237 trips bike share carried in 2024 gives an estimated $25.06 a trip, against Micro’s audited $32.40. The bike estimate combines a 2026 contract rate with 2024 trips; Micro’s reported figure uses costs and boardings from the same fiscal year. On total public cost the bikes come out 23 percent cheaper, not an order of magnitude cheaper.
What separates the two is who pays. Both board reports allocate bike share operating costs 35 percent Metro, 65 percent City of Los Angeles. Metro holds the contract, pays the operator, and recovers most of it from the city.
Metro funds Micro alone. Set against it, the comparable bike share figure is Metro’s own 35 percent share, an estimated $8.77 a trip: about 73 percent less per trip on the same allocated-average basis. That is a comparison of averages, and it should not be read as a claim that moving riders between the two services would cost that, since neither program’s costs scale in a straight line and the bikes would need capacity that is currently switched off.
In the one zone where both run, the bikes carry more
The two programs overlap in one place. The UCLA, Westwood and VA Medical Center Micro zone covers 7.18 square miles, and eleven bike share docks sit inside it, ten of them still switched on.
In May 2025, Micro recorded 3,596 boardings in that zone. Bike share recorded 5,110 trips from those ten docks, 42 percent more, in a zone Metro is also paying to cover on demand. The two are different units, a van boarding against a bike trip, and neither counts unique riders. The bike trips carried no onboard driver, though bike share has its own labor cost in rebalancing and maintenance.
That zone is not typical, and the rest of the map does not support the general version of this argument. We put all eight Micro zones against the bike share station map, and Micro carries more than the bikes in seven of them. In the Altadena, Pasadena and Sierra Madre zone, Micro did 12,028 boardings in May 2025; bike share, at its 2017 peak, did 23,549 trips in a whole year across 31 docks, which is about two rides per dock per day.
Where the vans and the bikes cover the same ground
Metro Micro boardings and Metro Bike Share trips inside the same zone, May 2025. The bikes carry more in one zone of the eight.
micro_zones.geojson.Bike share came out ahead only in the dense Westwood overlap. Micro recorded more boardings in the other seven zones, most of which have no docks in service at all.
Nearly half the dock locations used since 2016 are inactive
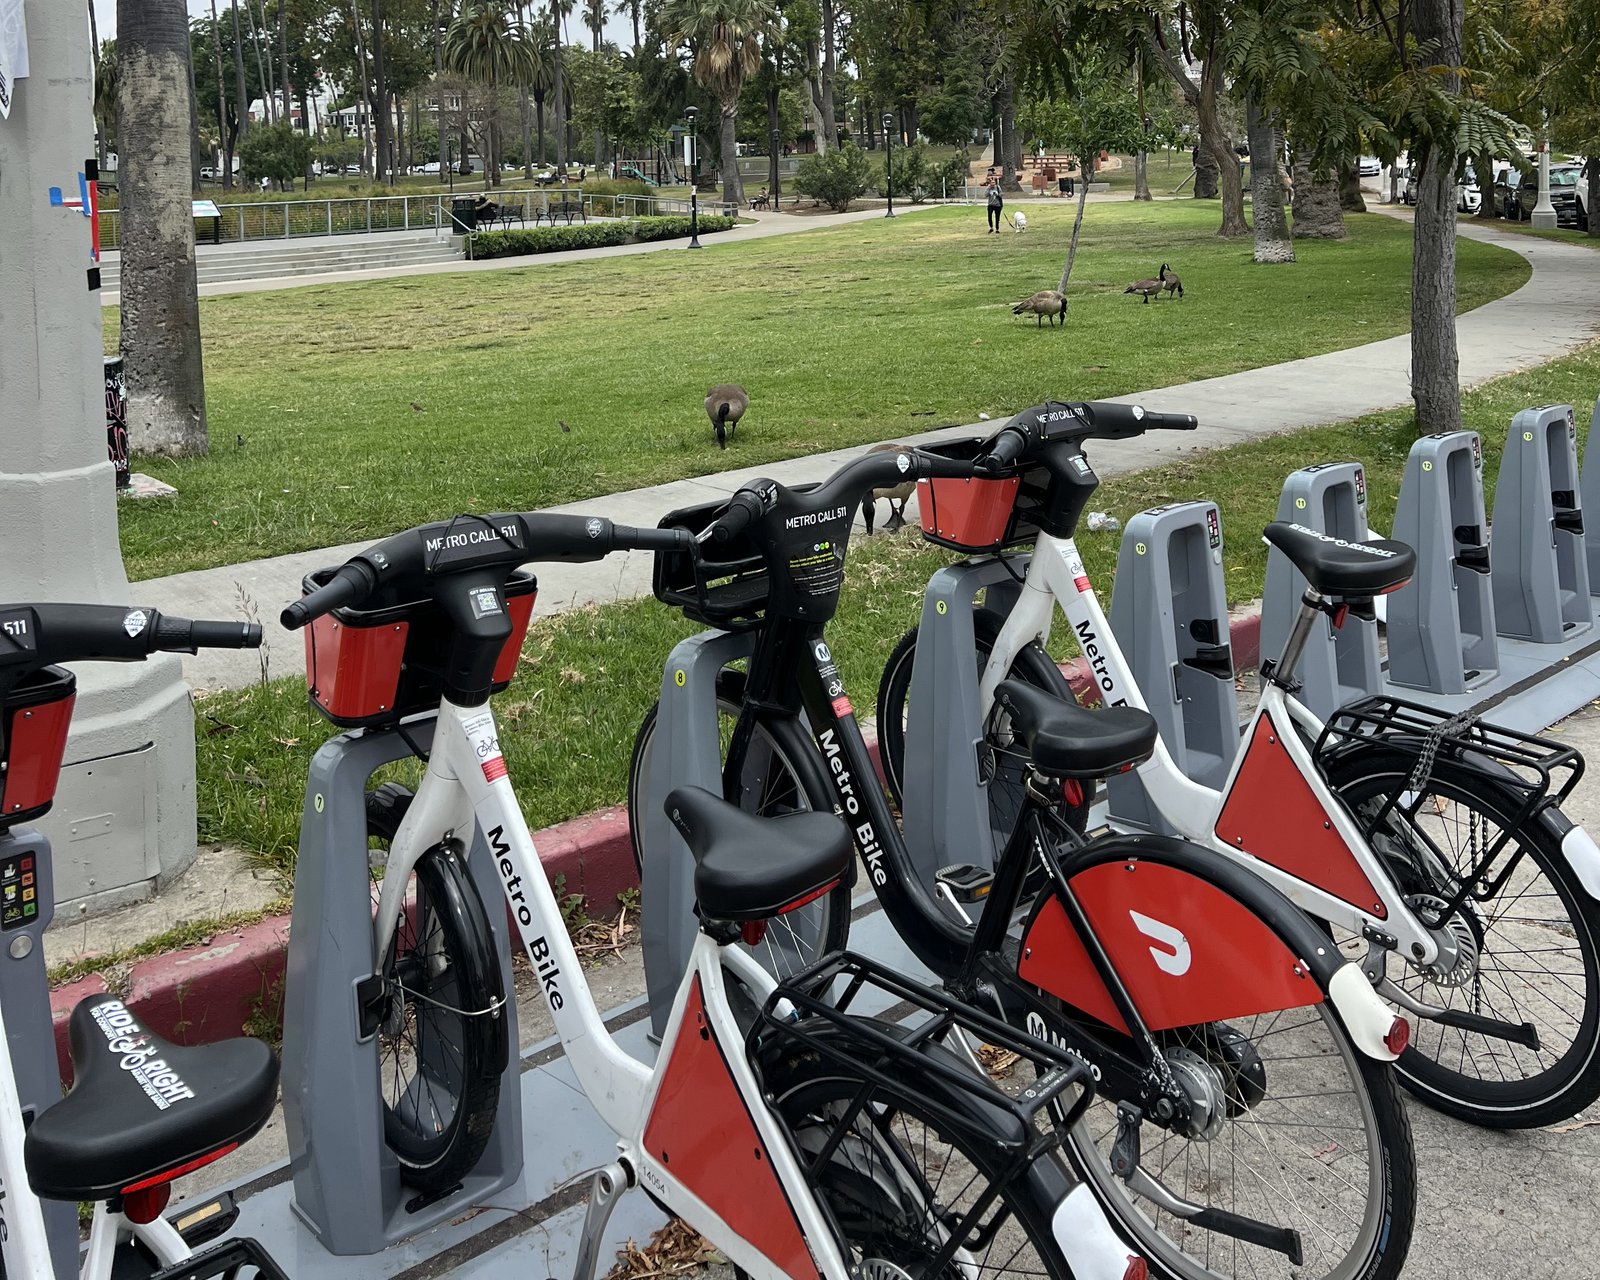
The reason the overlap is only one zone is that Metro Bike Share has been shrinking for years.
Of the 464 dock locations that have carried a trip since the July 2016 launch, 226 are marked inactive on Metro’s current station table, leaving 225 active and 13 unlisted. That is a count of locations across the system’s whole life, not a system that halved in one step. Two of its four original service areas are gone completely. Pasadena had 31 docks and its last recorded ride was 16 August 2018. The Port of Los Angeles had 13 and its last was 15 November 2019. We found no board report or press release announcing either withdrawal in the Metro records we searched, which were the bike share items in the board agenda system through August 2026.
Some of the inactive docks were among the system’s busiest. 7th and Spring, in downtown, is the eleventh busiest dock in the system’s history at 91,484 trip endpoints, and it is switched off.
Ridership fell 16.1 percent in 2025 and is down another 10.2 percent through June 2026. The contract does not shrink with it, so the same run rate spread over fewer trips rises: an estimated $25.06 a trip in 2024, $29.95 in 2025.
Metro has not published the two side by side
The programs sit in different cost centers, report to different federal categories, and only one of them has a line in the National Transit Database. We found no Metro document setting them against each other in the board records we searched.
Set against each other, the two compare as follows. Metro is paying $32.40 a boarding to carry about four riders a vehicle hour, in eight zones it chose, while the program that costs it an estimated $8.77 a trip has had nearly half its dock locations go inactive and has left two of its four cities with no announcement we could find.
The two are not interchangeable. Micro’s zones were picked partly for equity, and two of them, El Monte at 73.3 percent and Watts and Compton at 69.8 percent, are majority Equity Focus Community by population. A van reaches riders a bicycle cannot, including people who cannot ride one, and the 7.18 square mile Westwood zone and the 32 square mile Watts zone are answering different problems. Those are real benefits and this piece does not price them.
What Metro has published are the cost figures: $32.40 a boarding, 1.7 percent farebox recovery, and 3.89 boardings a vehicle hour, in the service’s fourth full year. We found no published document weighing those against the access benefits described above.
Metro Micro figures are from Metro’s National Transit Database filings and from board reports 2023-0376, 2024-0153 and 2025-0473. Bike share operating cost is derived from board files 2026-0501 and 2023-0616; per-trip figures apply that annualized run rate to a calendar-year trip count and are estimates, not reported costs. Trip counts come from Metro Bike Share’s published quarterly trip files, 3,239,857 rides from July 2016 to June 2026.