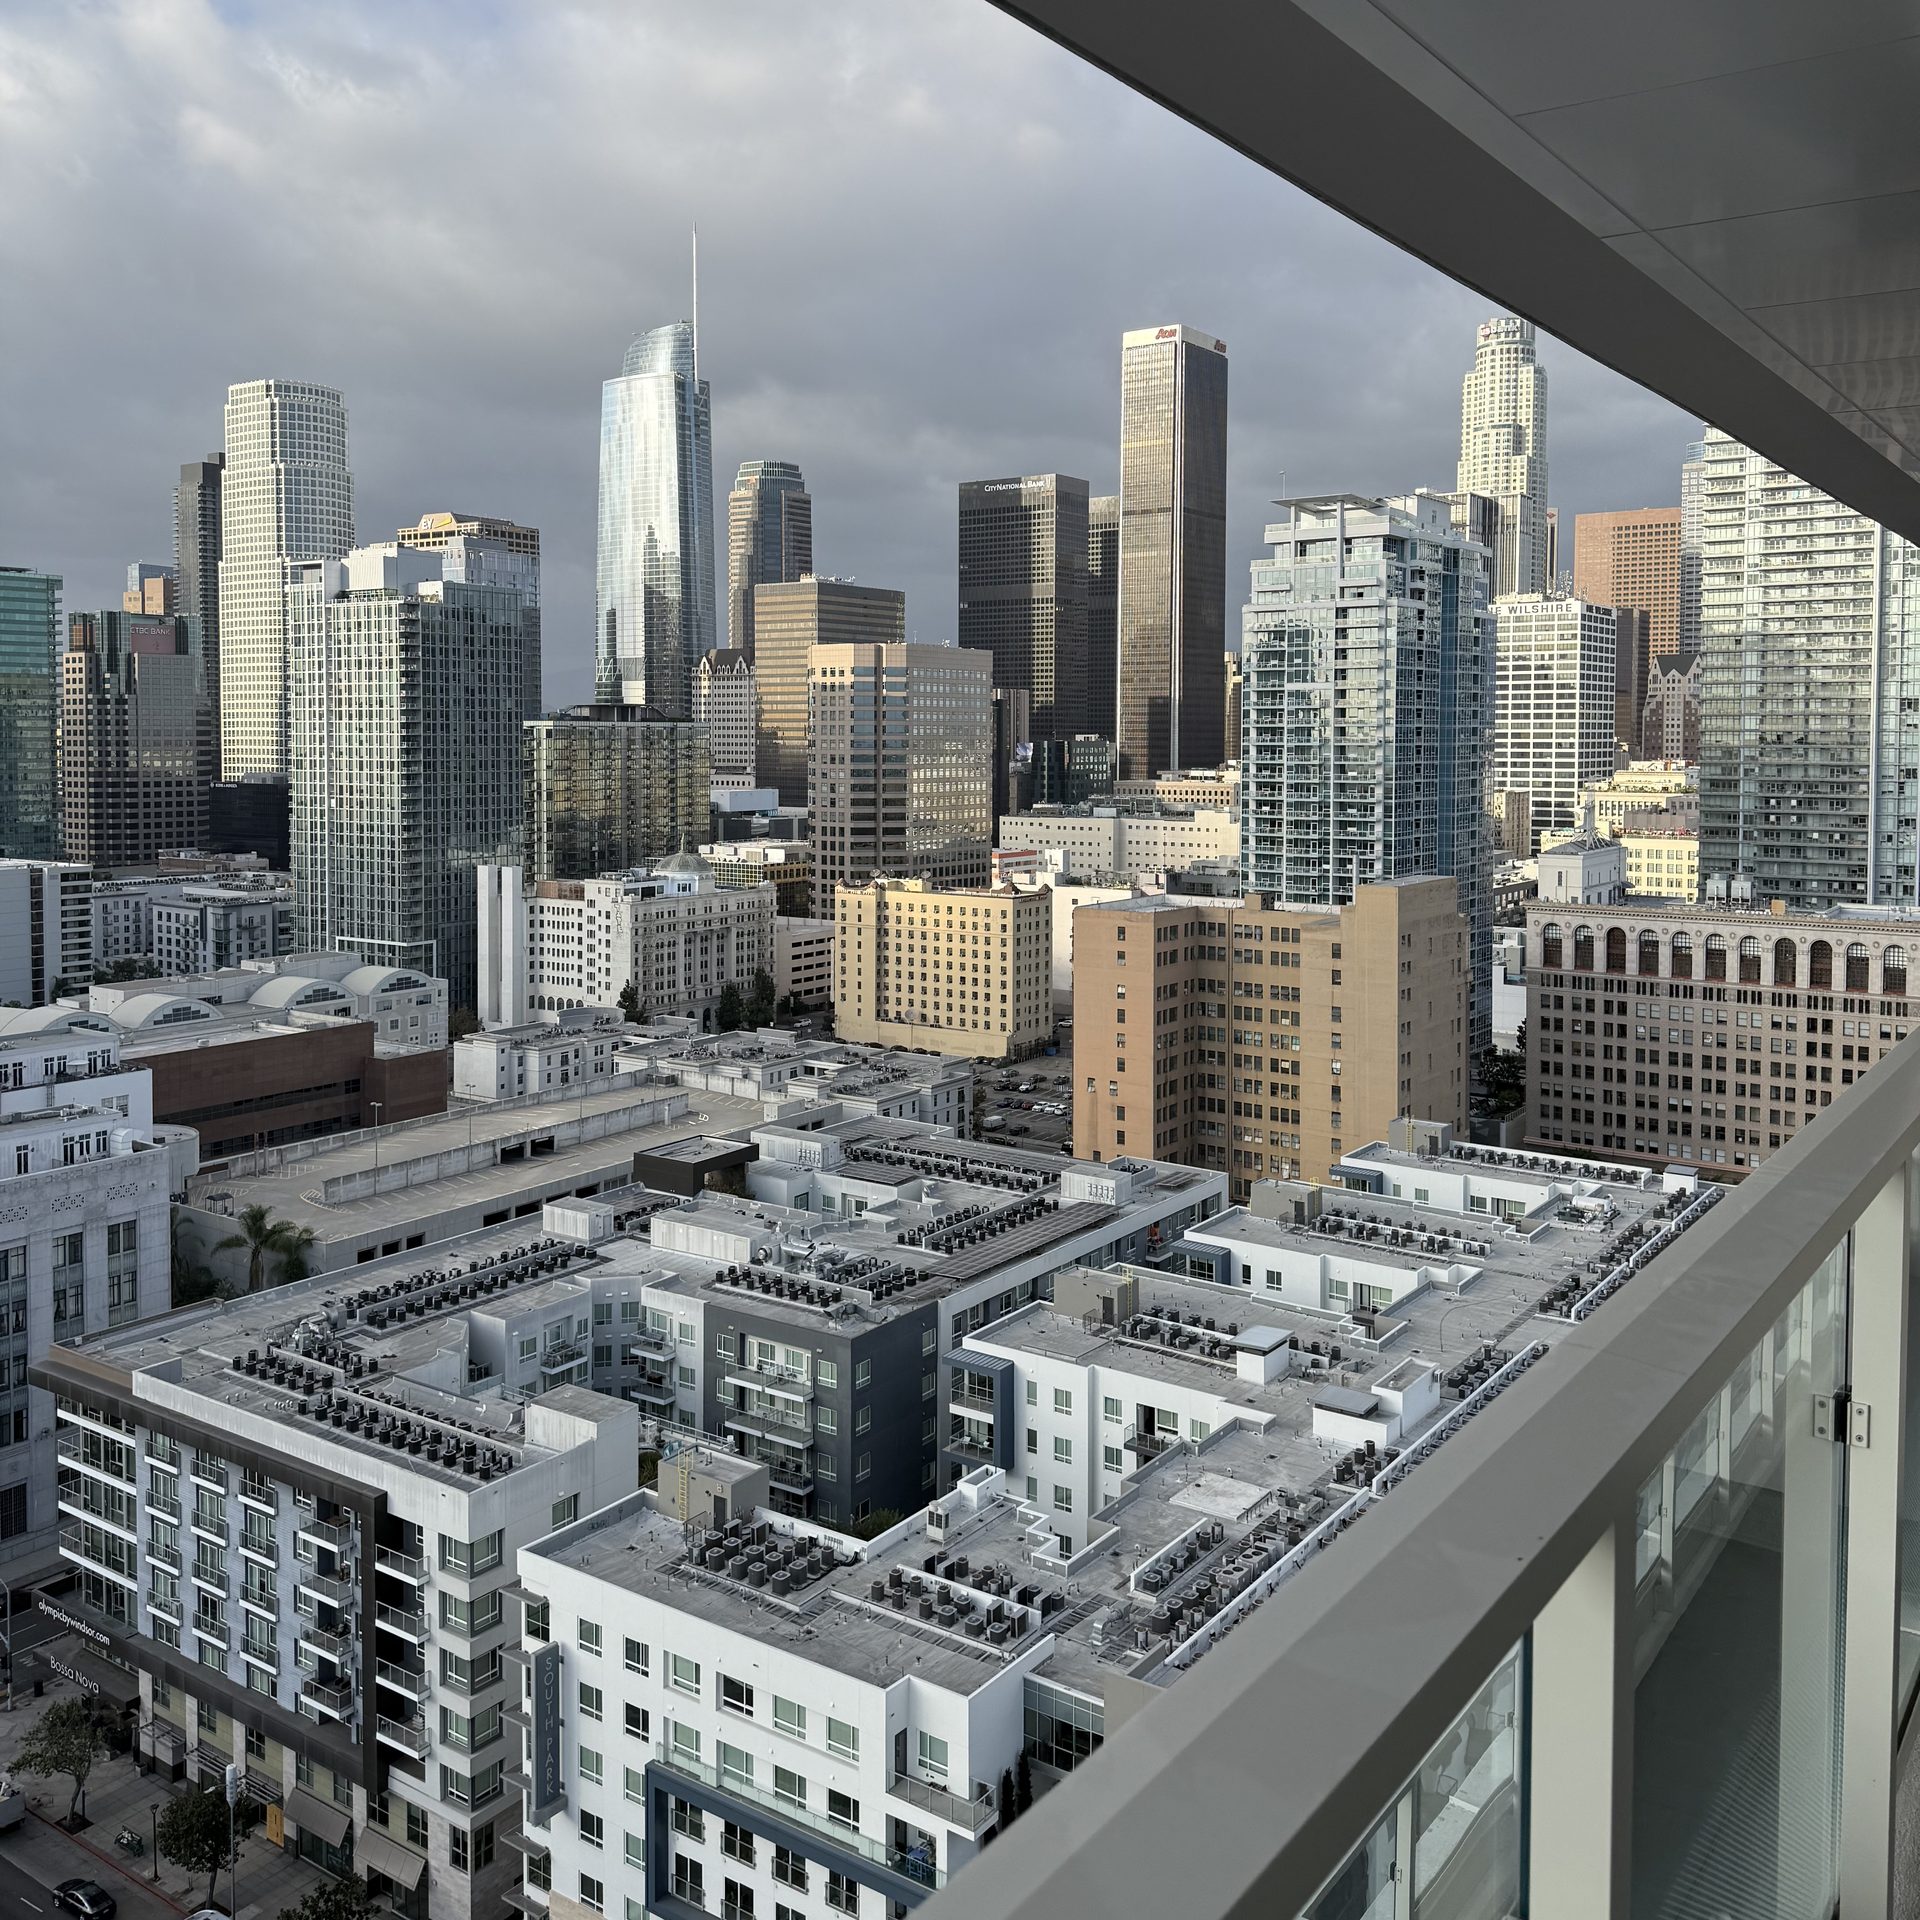
The census has recorded what housing costs in Los Angeles since 1940. Adjusted to 2026 dollars, the median home now costs about 8.8 times what it did then. The median rent costs about 2.7 times.
We pulled the median home value, the median gross rent, the median household income and the binding minimum wage for the City of Los Angeles at five census benchmarks from 1940 to 2020, with a separately measured 2026 estimate alongside them, and converted every figure into 2026 dollars so the comparison is what an Angeleno earned and paid, not what the price tag said.
| Year | Median home | Median rent | Median income | Minimum wage | Home as multiple of income |
|---|---|---|---|---|---|
| 1940 | $97,011 | $722 | not published | $7.61 | |
| 1960 | $203,349 | $917 | not published | $11.75 | |
| 1980 | $404,869 | $1,104 | $66,292 | $13.06 | 6.11 |
| 2000 | $455,388 | $1,381 | $75,392 | $11.82 | 6.04 |
| 2020 | $849,039 | $1,928 | $82,651 | $18.99 | 10.27 |
Rent kept pace with the wage floor
A housing cost can also be measured in hours of work. Take the lowest legal wage in Los Angeles in each year and ask how many hours it took to cover one month's median rent.
- 1940: 94.8 hours
- 1960: 78.0 hours
- 1980: 84.5 hours
- 2000: 116.9 hours
- 2020: 101.5 hours
Eighty years apart, the two endpoints are close. A minimum-wage worker in 2020 Los Angeles needed about a week more work per year to cover rent than one in 1940, and considerably less than one in 2000. The series in between is not flat: it runs from 78.0 hours in 1960 to 116.9 in 2000, a spread of about 50 percent, and these are five snapshots twenty years apart rather than a continuous record.
Rent did not stop rising; the wage floor rose with it. In 2026 dollars the minimum wage went from $7.61 in 1940 to $18.99 in 2020, and Los Angeles adopting its own city minimum wage is most of why the 2020 figure is so much higher than the 2000 one. Rent roughly tripled in real terms over eighty years, and the wage floor roughly tripled too.
None of this makes rent affordable. A hundred hours a month is more than half of a full-time schedule going to housing alone, and the share of income the median renter household spends on rent still climbed from 20 percent in 1980 to 28 percent in 2020. Relative to the bottom of the labor market, a month's rent took 101.5 minimum-wage hours in 2020 against 94.8 in 1940, with no sustained trend between them.
Home values outpaced household income after 2000
A median Los Angeles home cost 6.11 times a median household's annual income in 1980 and 6.04 times in 2000. By 2020 it cost 10.27 times.
Real household income is the reason. Between 1980 and 2020 the real median home value rose 110 percent while real median household income rose 24.7 percent. Wages grew; home values grew more than four times as fast.
Renting a median home took about the same minimum-wage hours in 2020 as in 1940. Buying one took nearly twice the income it did in 2000.
What is happening now, on a different measurement
There is no 2026 census, so the current column comes from market estimates rather than a decennial count: Zillow's home value and observed rent indices, with income from the most recent American Community Survey. It is not comparable to the columns above, and we draw it separately for that reason. It indicates direction, not a sixth benchmark.
On that basis, the median Los Angeles home is around $949,000 and median asking rent around $2,773 a month. Against the most recent published median household income of $82,263, that is a home costing 11.5 times a year's income, and rent taking about 41 percent of it. Minimum-wage hours to cover a month's rent come out around 151, against 102 in 2020.
One number in that picture does not depend on the basis question, because it is a matter of law and arithmetic. The Los Angeles minimum wage is worth less today than it was in 2020. In 2026 dollars it stood at $18.99 then and $18.42 now, a real decline of 57 cents an hour, because the nominal increases since 2020 have not kept up with the price index. On the market basis above, which is not comparable to the census benchmarks, the hours figure has moved further since 2020 than it did between any two of them.
Method
Figures are for the City of Los Angeles, from the decennial Census of Housing and the American Community Survey, deflated to 2026 dollars using the Bureau of Labor Statistics consumer price index for the Los Angeles metropolitan area, which is the finest geography that index is published at. The minimum wage is whichever of the federal, state or city floor was binding in Los Angeles in that year.
Three limits.
The Census moved what it was counting. The 1940 figures cover urban and rural-nonfarm units and were read from a scanned volume. The 1980 median home value counts non-condominium units only. 1980 and 2000 use the narrower "specified" owner-occupied and renter-occupied universes, while 1940 and 2020 use broader ones. These are each decade's standard definitions, and every long housing series carries them. They are why the multipliers here are approximate.
Median household income is not published for the City of Los Angeles before 1980. We left those two cells blank rather than estimate them, which is why no home-to-income multiple appears for 1940 or 1960.
Gross rent includes utilities, and has in every year here, which makes it the right series for a cost-of-living comparison and the wrong one for comparing to a landlord's asking rent.
Every figure in this piece is reproduced in the released dataset with its own geography, universe and source on its own row, including the cells we left empty and the reason why.