
The weather station at Pierce College in Woodland Hills recorded a high of 100°F or hotter on 42.8 days a year on average from 2016 through 2025, according to NOAA’s daily station records. About 13 miles south, the station at Santa Monica’s airport averaged 0.6 such days a year over the same ten years. LAX averaged 0.7.
Those two numbers come from the same city and the same summers. Woodland Hills is inside Los Angeles, and so is LAX. The difference is the Santa Monica Mountains and the ocean air that stops at them.
The rest of the Valley sits between the two ends. Van Nuys airport averaged 20.9 days a year at 100 degrees, and the two Burbank stations six to seven. Downtown, at the USC station that serves as the city’s official record, averaged 1.8.


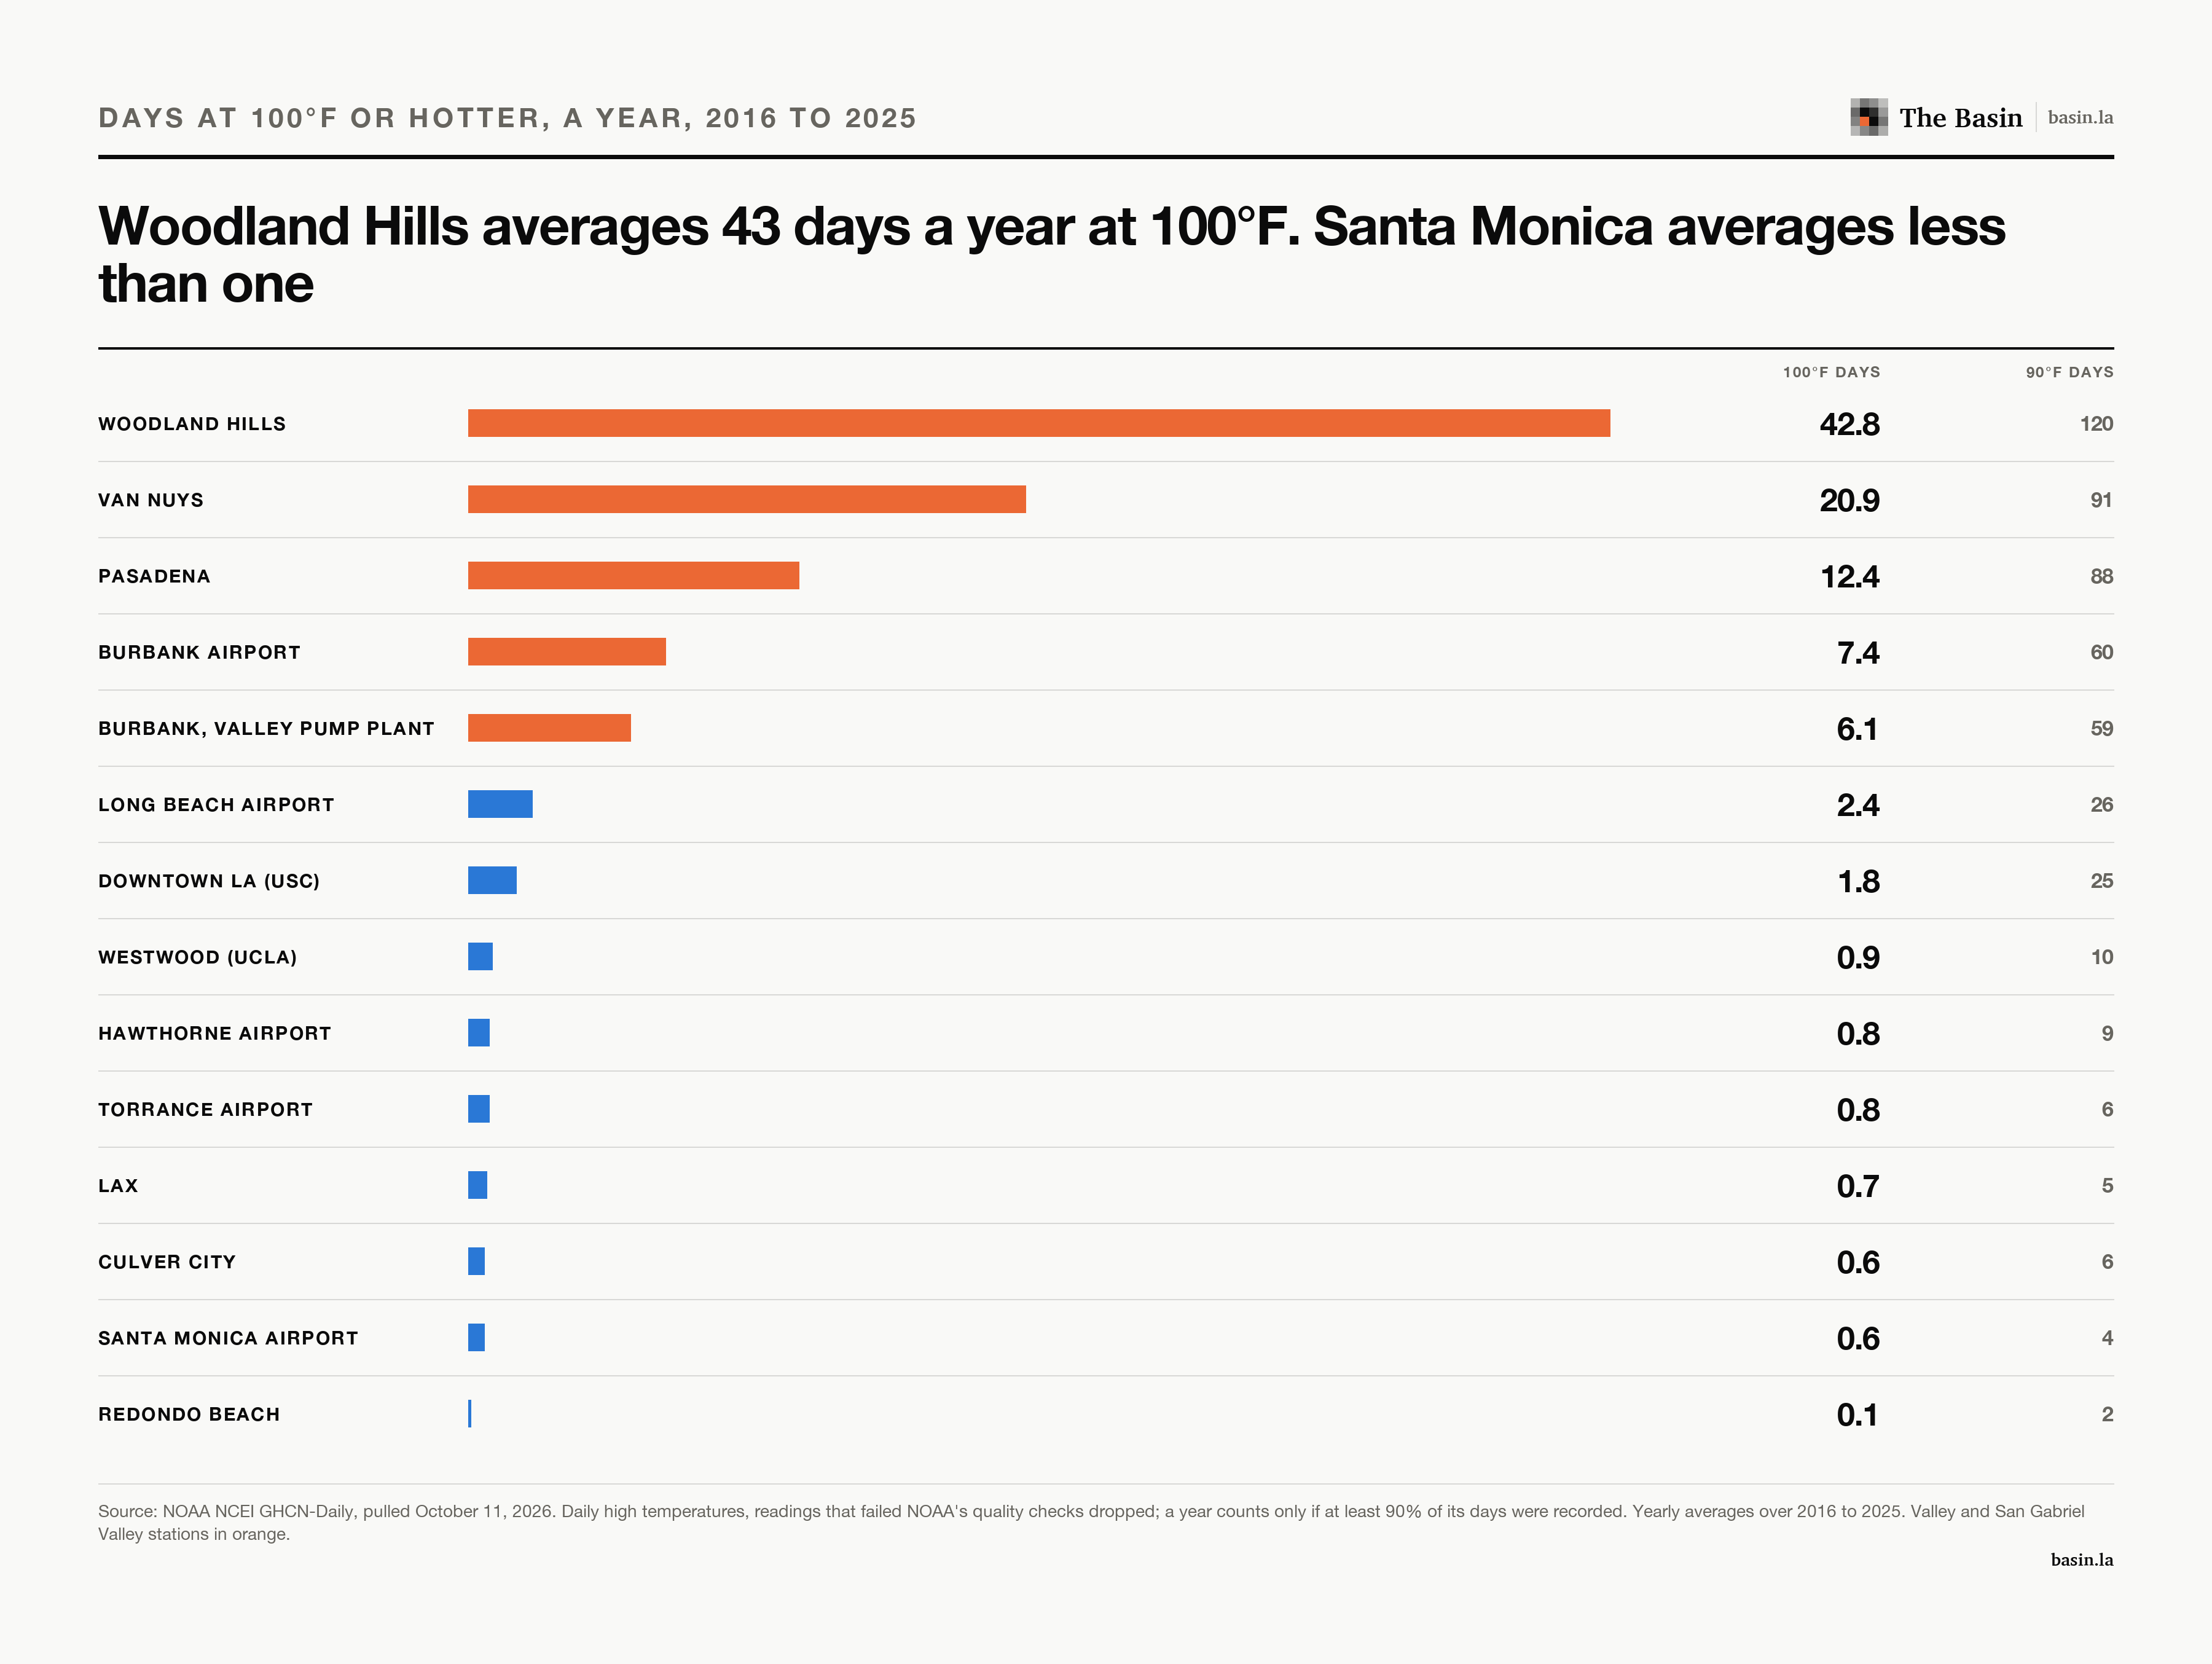
At 90 degrees the split is the same shape and much larger. Woodland Hills reached 90 on 120 days a year, about four months. Santa Monica reached it on four days and LAX on five.
The hottest reading in the ten years came on September 6, 2020, when the Pierce College station recorded 120°F, the highest temperature in its record. Van Nuys hit 118 that day. Santa Monica’s hottest day of the decade was 101.
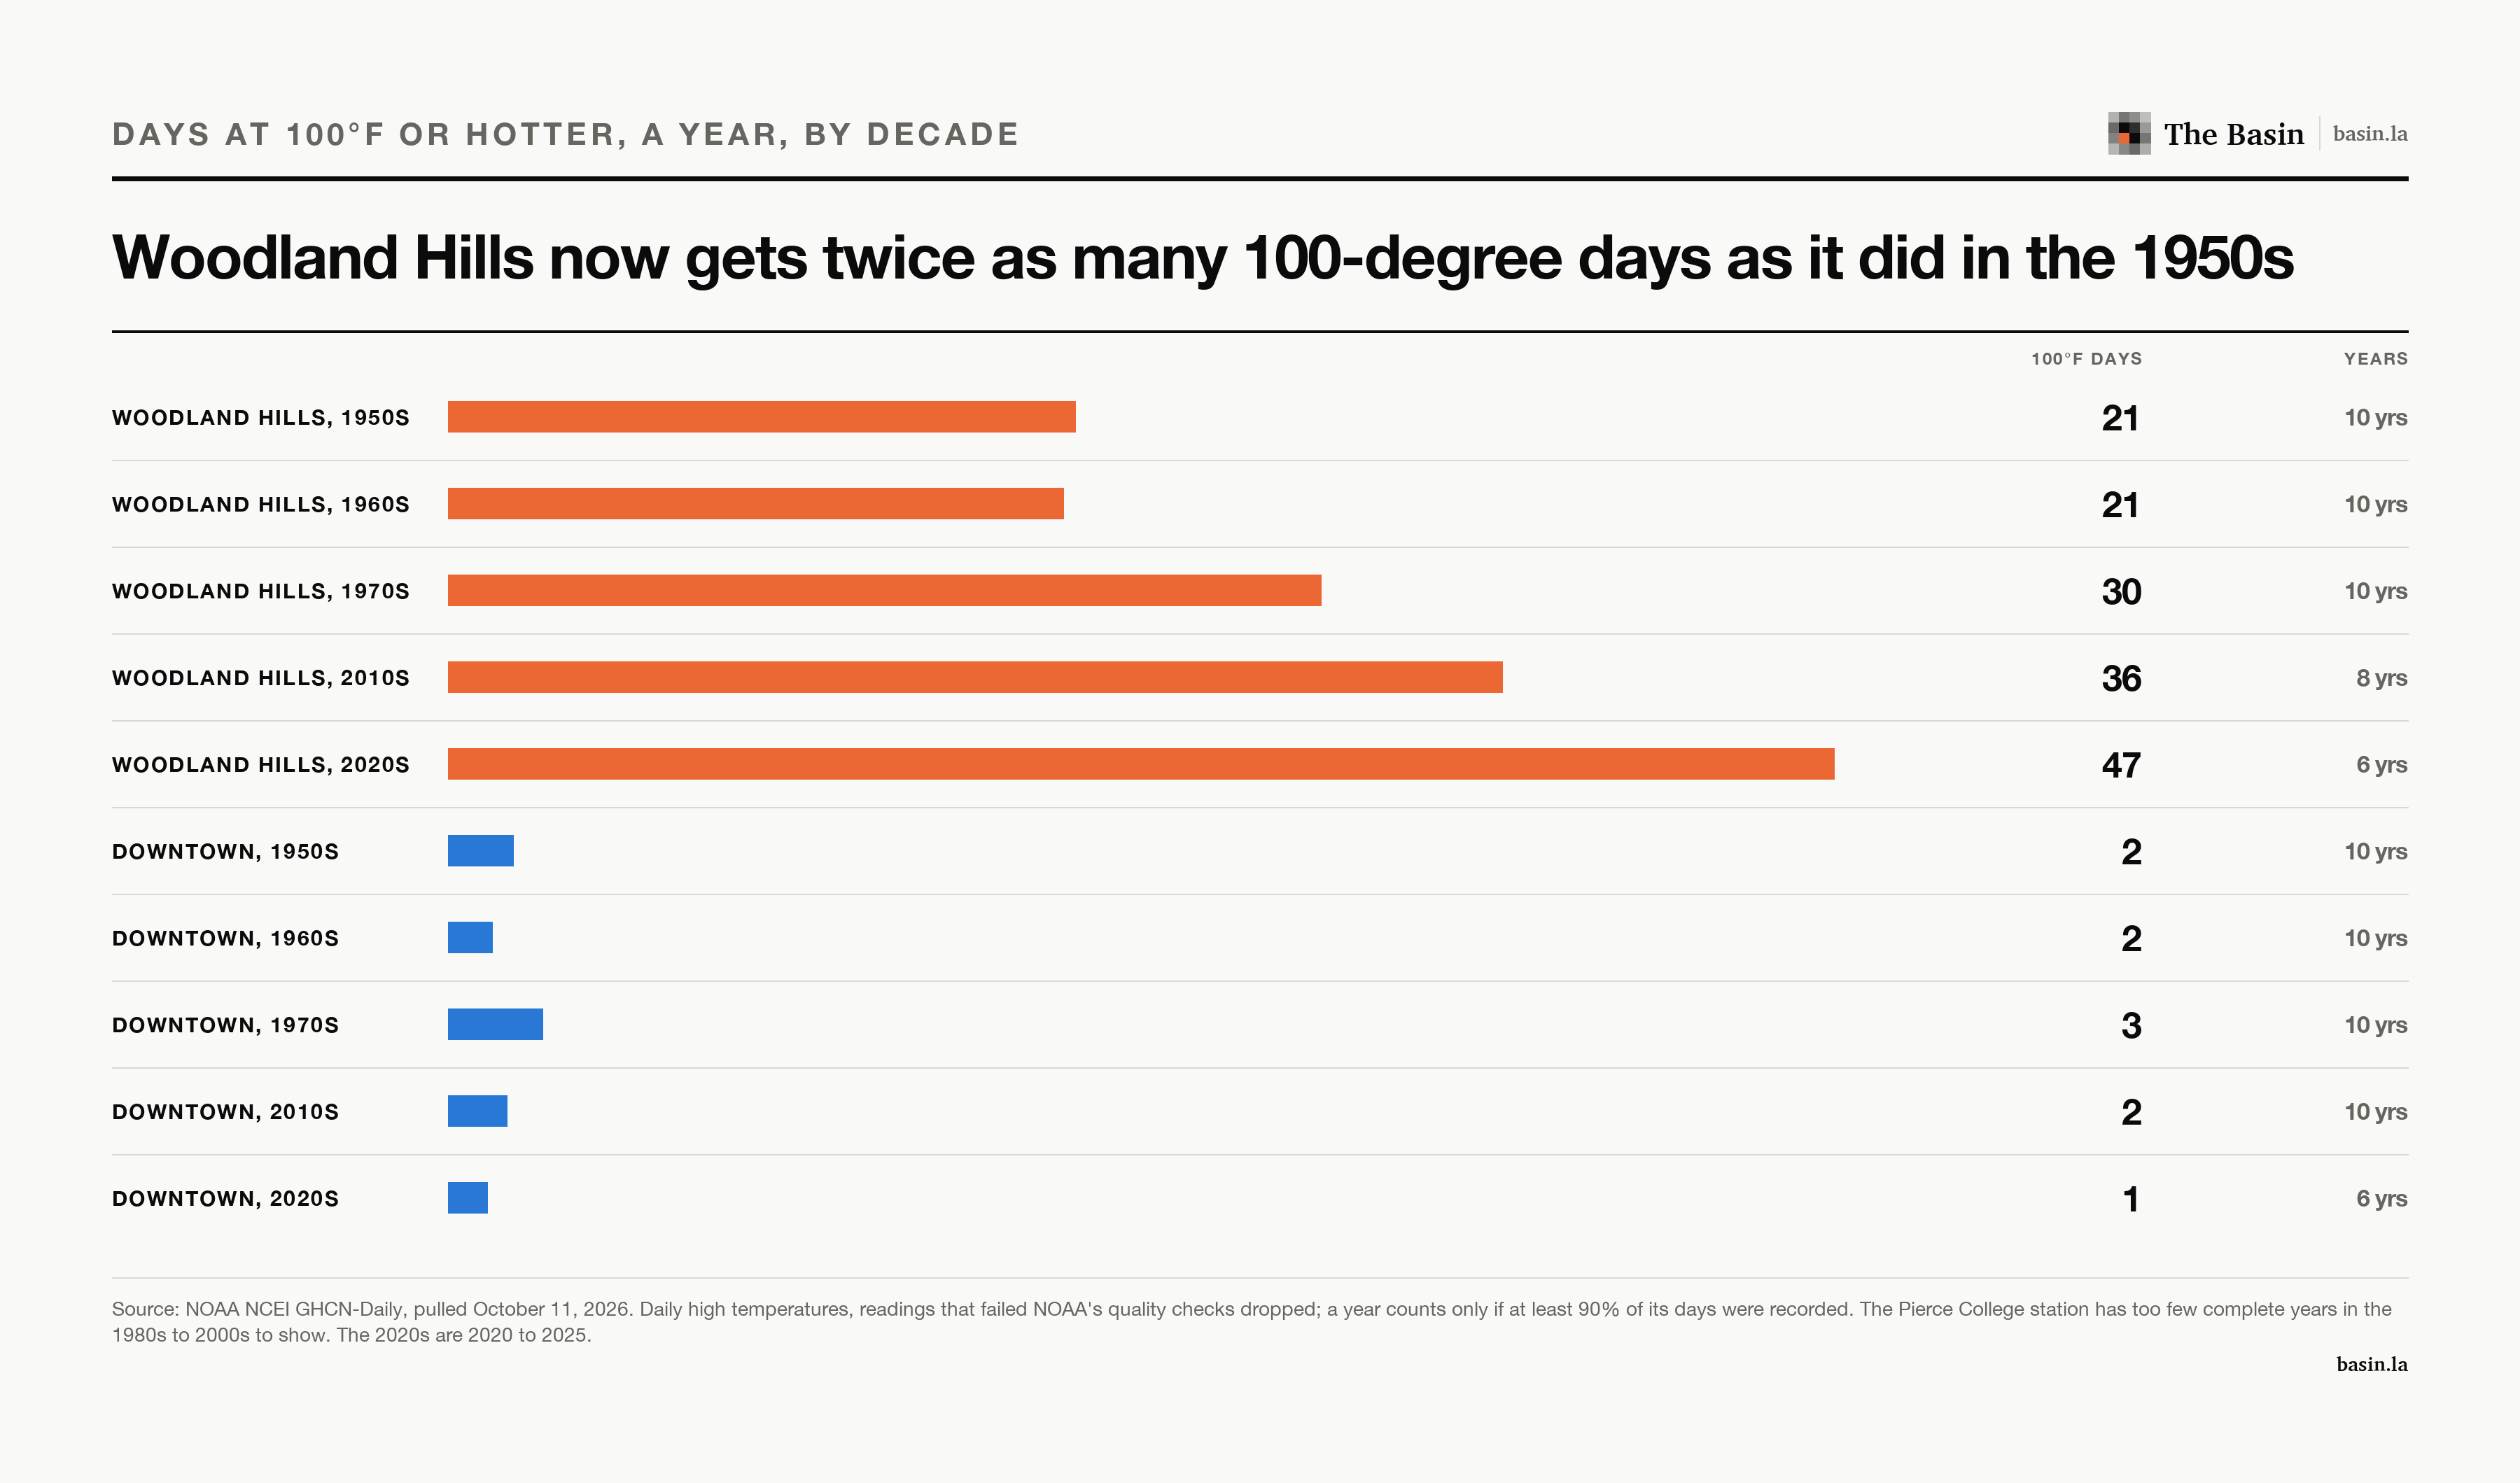
The gap has been widening at the hot end. In the 1950s, the Pierce College station averaged 21 days a year at 100 degrees. In the 2010s it averaged 36, and from 2020 through 2025 it has averaged 47. The station’s record has holes, with too few complete years in the 1980s, 1990s and 2000s to average, so the comparison runs between the decades that are whole. 2024 alone had 59 days at 100 or more, the second most of any year on record there.
Downtown hasn’t moved the same way. The USC station averaged 2.2 days a year at 100 degrees in the 1950s and 1.3 since 2020.


The weather stations measure air temperature in shaded boxes. They don’t record how hot a sidewalk, a bus stop or an apartment without air conditioning gets, and those readings can run far higher. Fourteen stations also can’t say which neighborhood in the city is hottest. They can only say that the hottest place the government measures in Los Angeles is in the West Valley, and that on a typical summer day the coast is a different climate.
Method. Daily maximum temperatures come from NOAA’s Global Historical Climatology Network daily files for every station between Redondo Beach and the Big Tujunga Dam still reporting in 2025. Readings flagged by NOAA’s quality checks were dropped, and a year counts only if at least 90% of its days were recorded. Stations with fewer than eight complete years from 2016 to 2025 were left out, which removed the Big Tujunga Dam gauge; a gauge at Pacoima Dam began reporting only in 2023. A day counts as 100 degrees if its high was 100.0°F or more after converting NOAA’s tenths of a degree Celsius. Some stations, including Pasadena, Burbank, Culver City, Torrance, Hawthorne, Long Beach and Redondo Beach, sit outside the city limits and are shown for the region. The code is in tools/heat/.