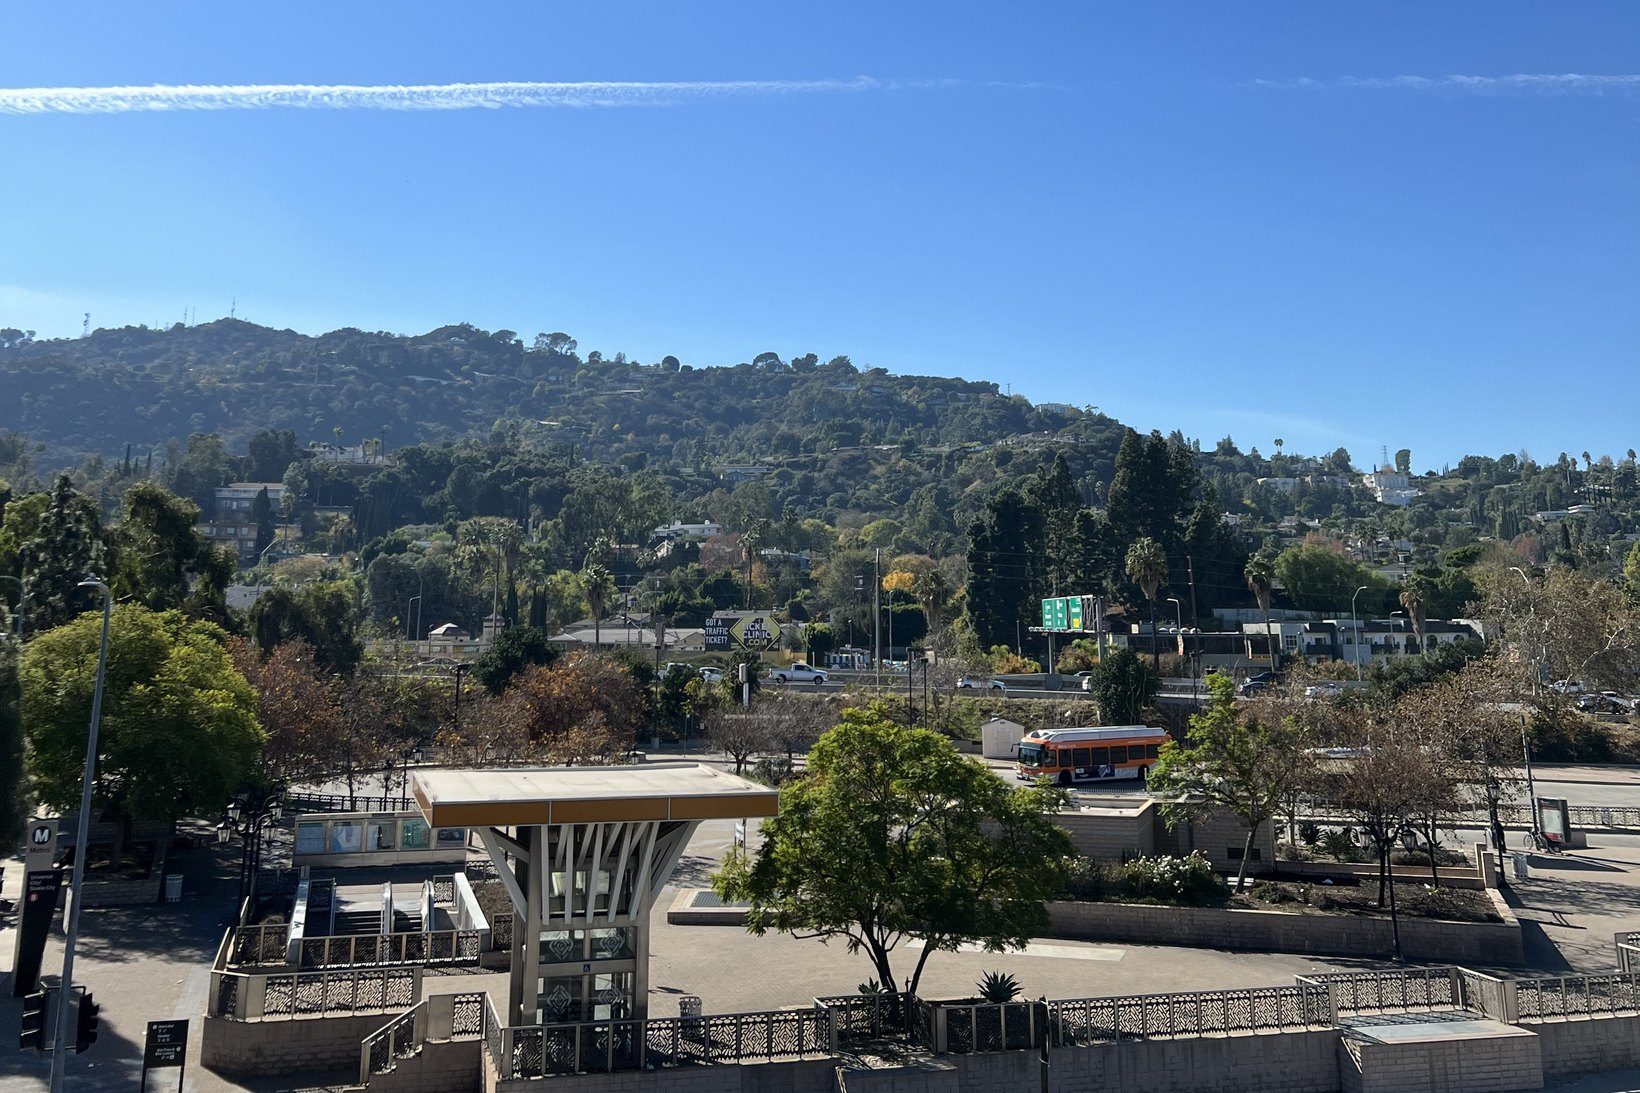
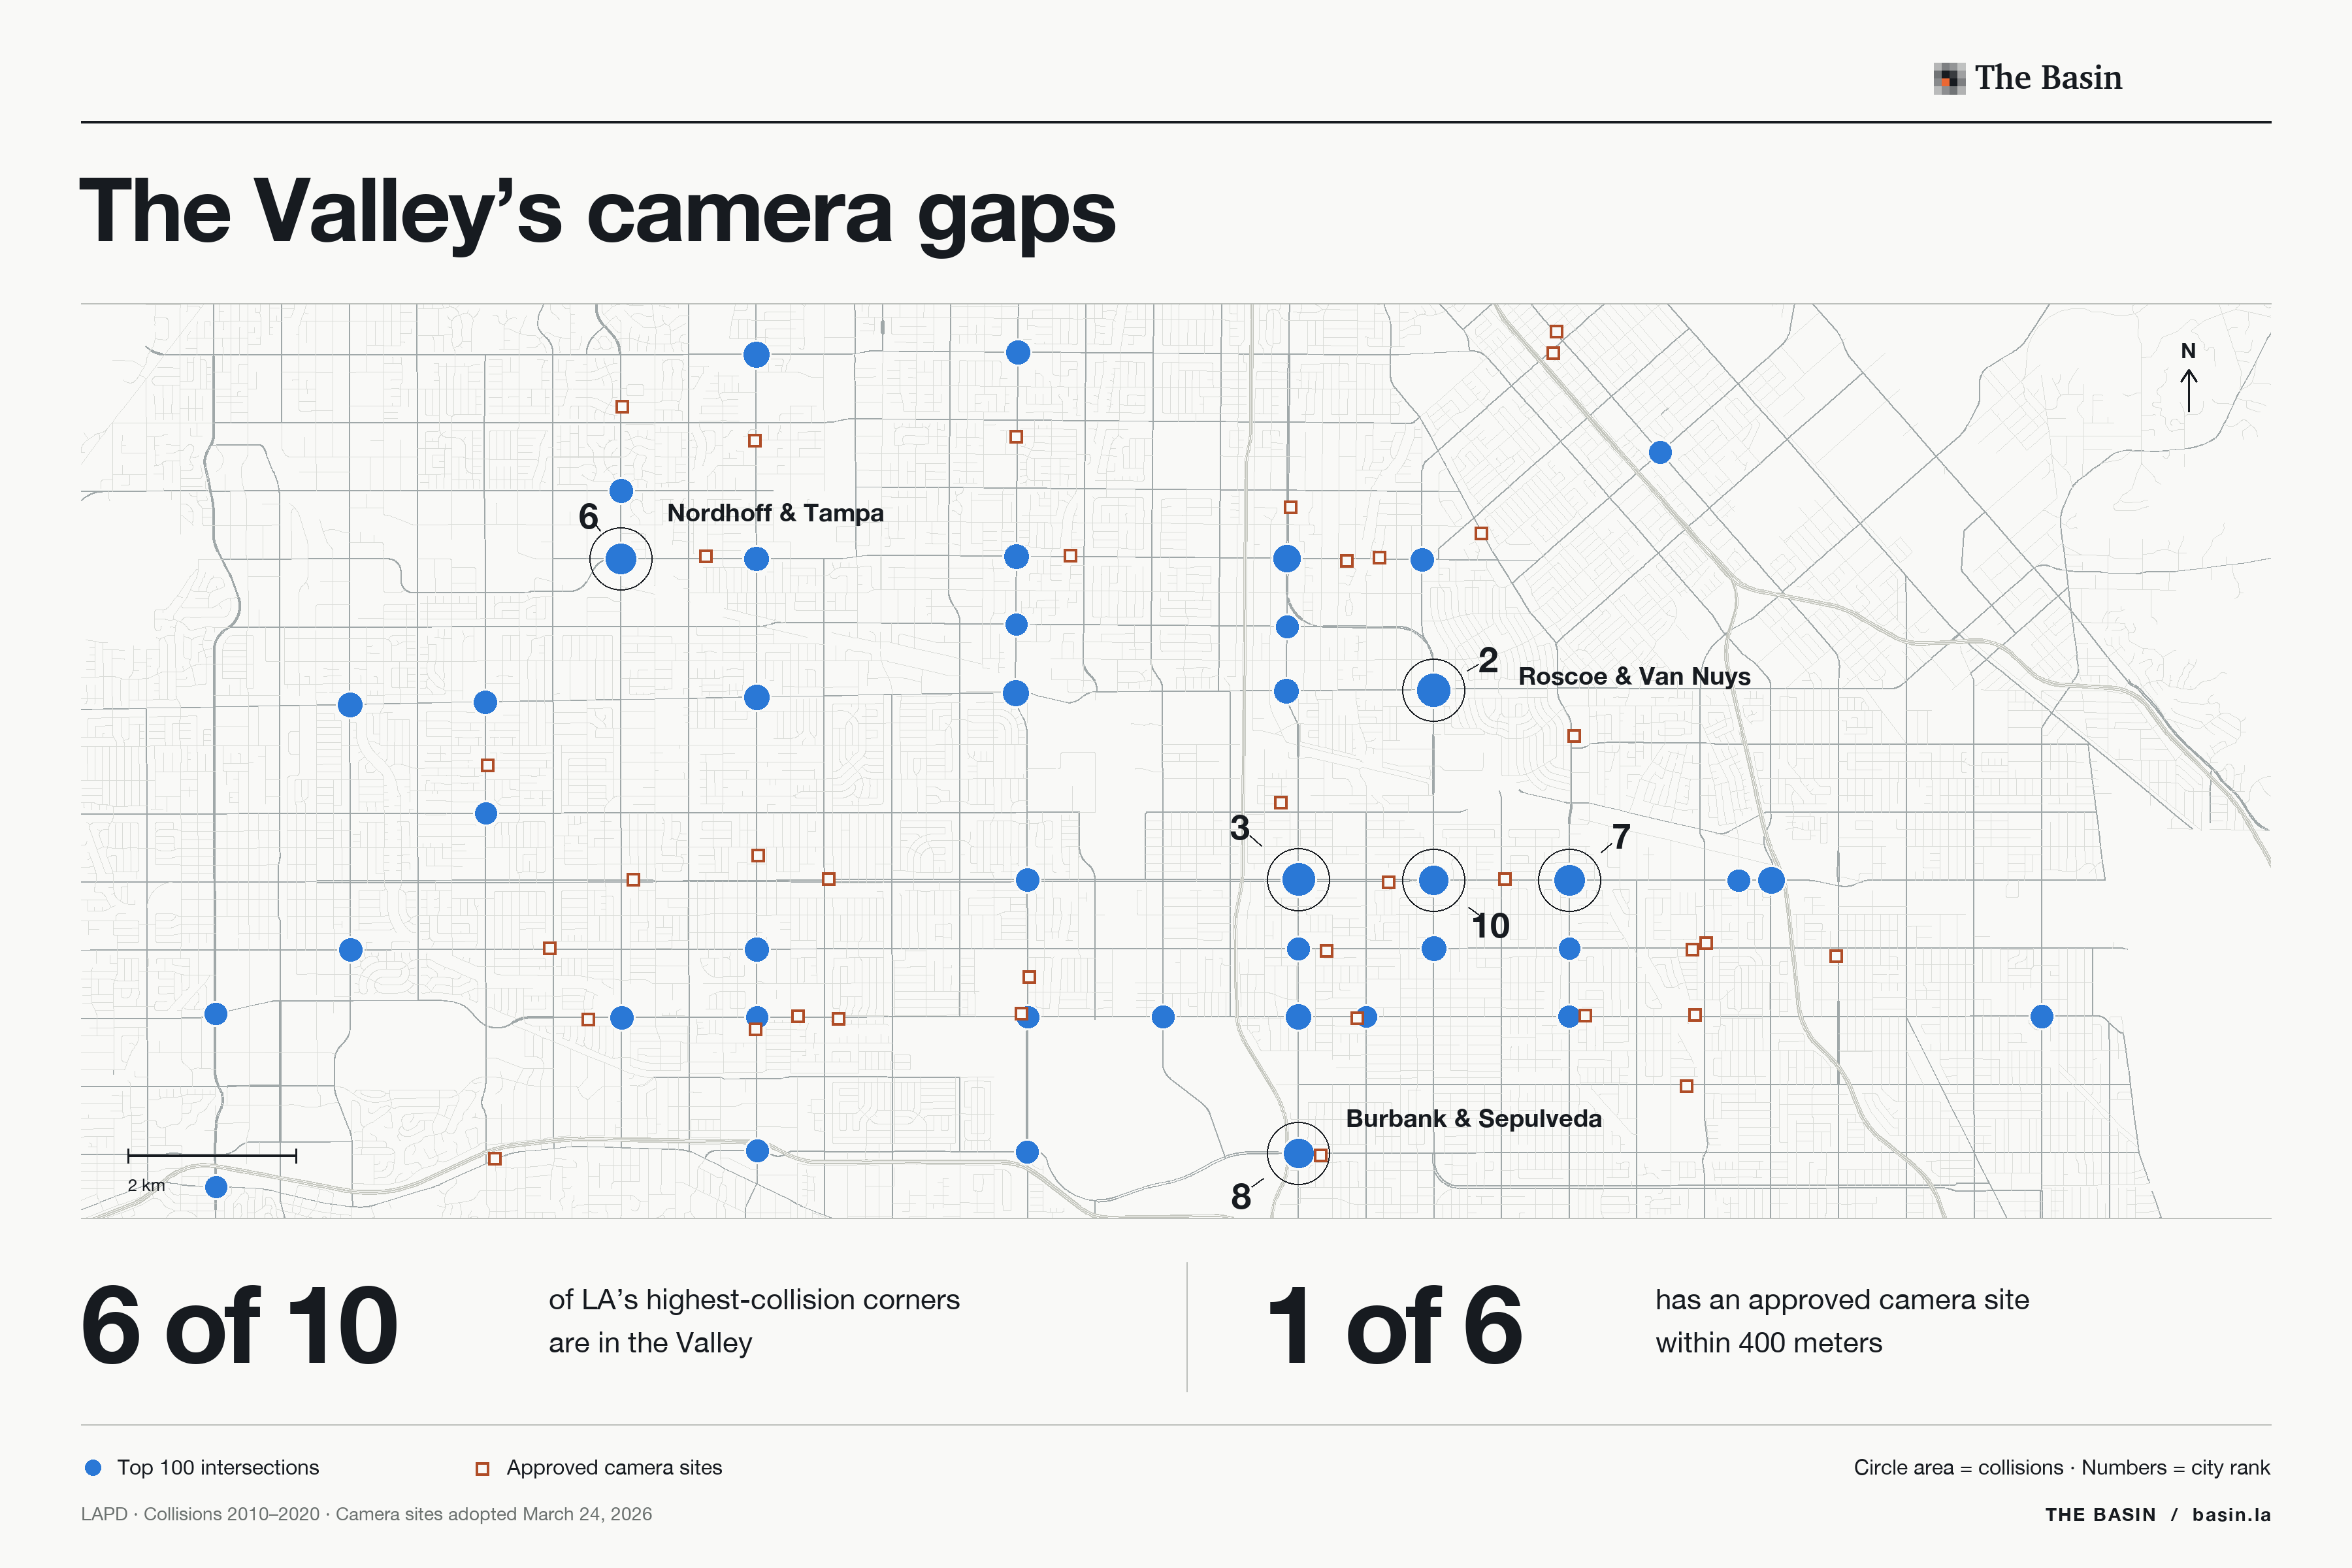
At Roscoe Boulevard and Van Nuys, two of the Valley's main roads meet at a crossing that accumulated 552 reported collisions between 2010 and 2020. Only one intersection in Los Angeles recorded more. When the city approved its speed camera locations this March, it chose no site within 400 meters of that corner.
Farther south, Sherman Way and Sepulveda Boulevard recorded 535 collisions over the same eleven years. That crossing also has no approved camera site nearby. Six of the city's ten highest-collision intersections are in the San Fernando Valley, and five of those six fall outside even that generous definition of camera coverage.
These are old crash records, ending six years ago. LAPD's published counts collapsed after 2020 for reporting reasons, and its collision file ends on March 8, 2025, so this isn't a live ranking.
The top ten
The Basin's ranking counts reported collisions at named intersections. It doesn't adjust for traffic volume or distinguish a fender bender from a fatal crash, so it describes where collisions concentrated rather than the risk of making any particular trip.
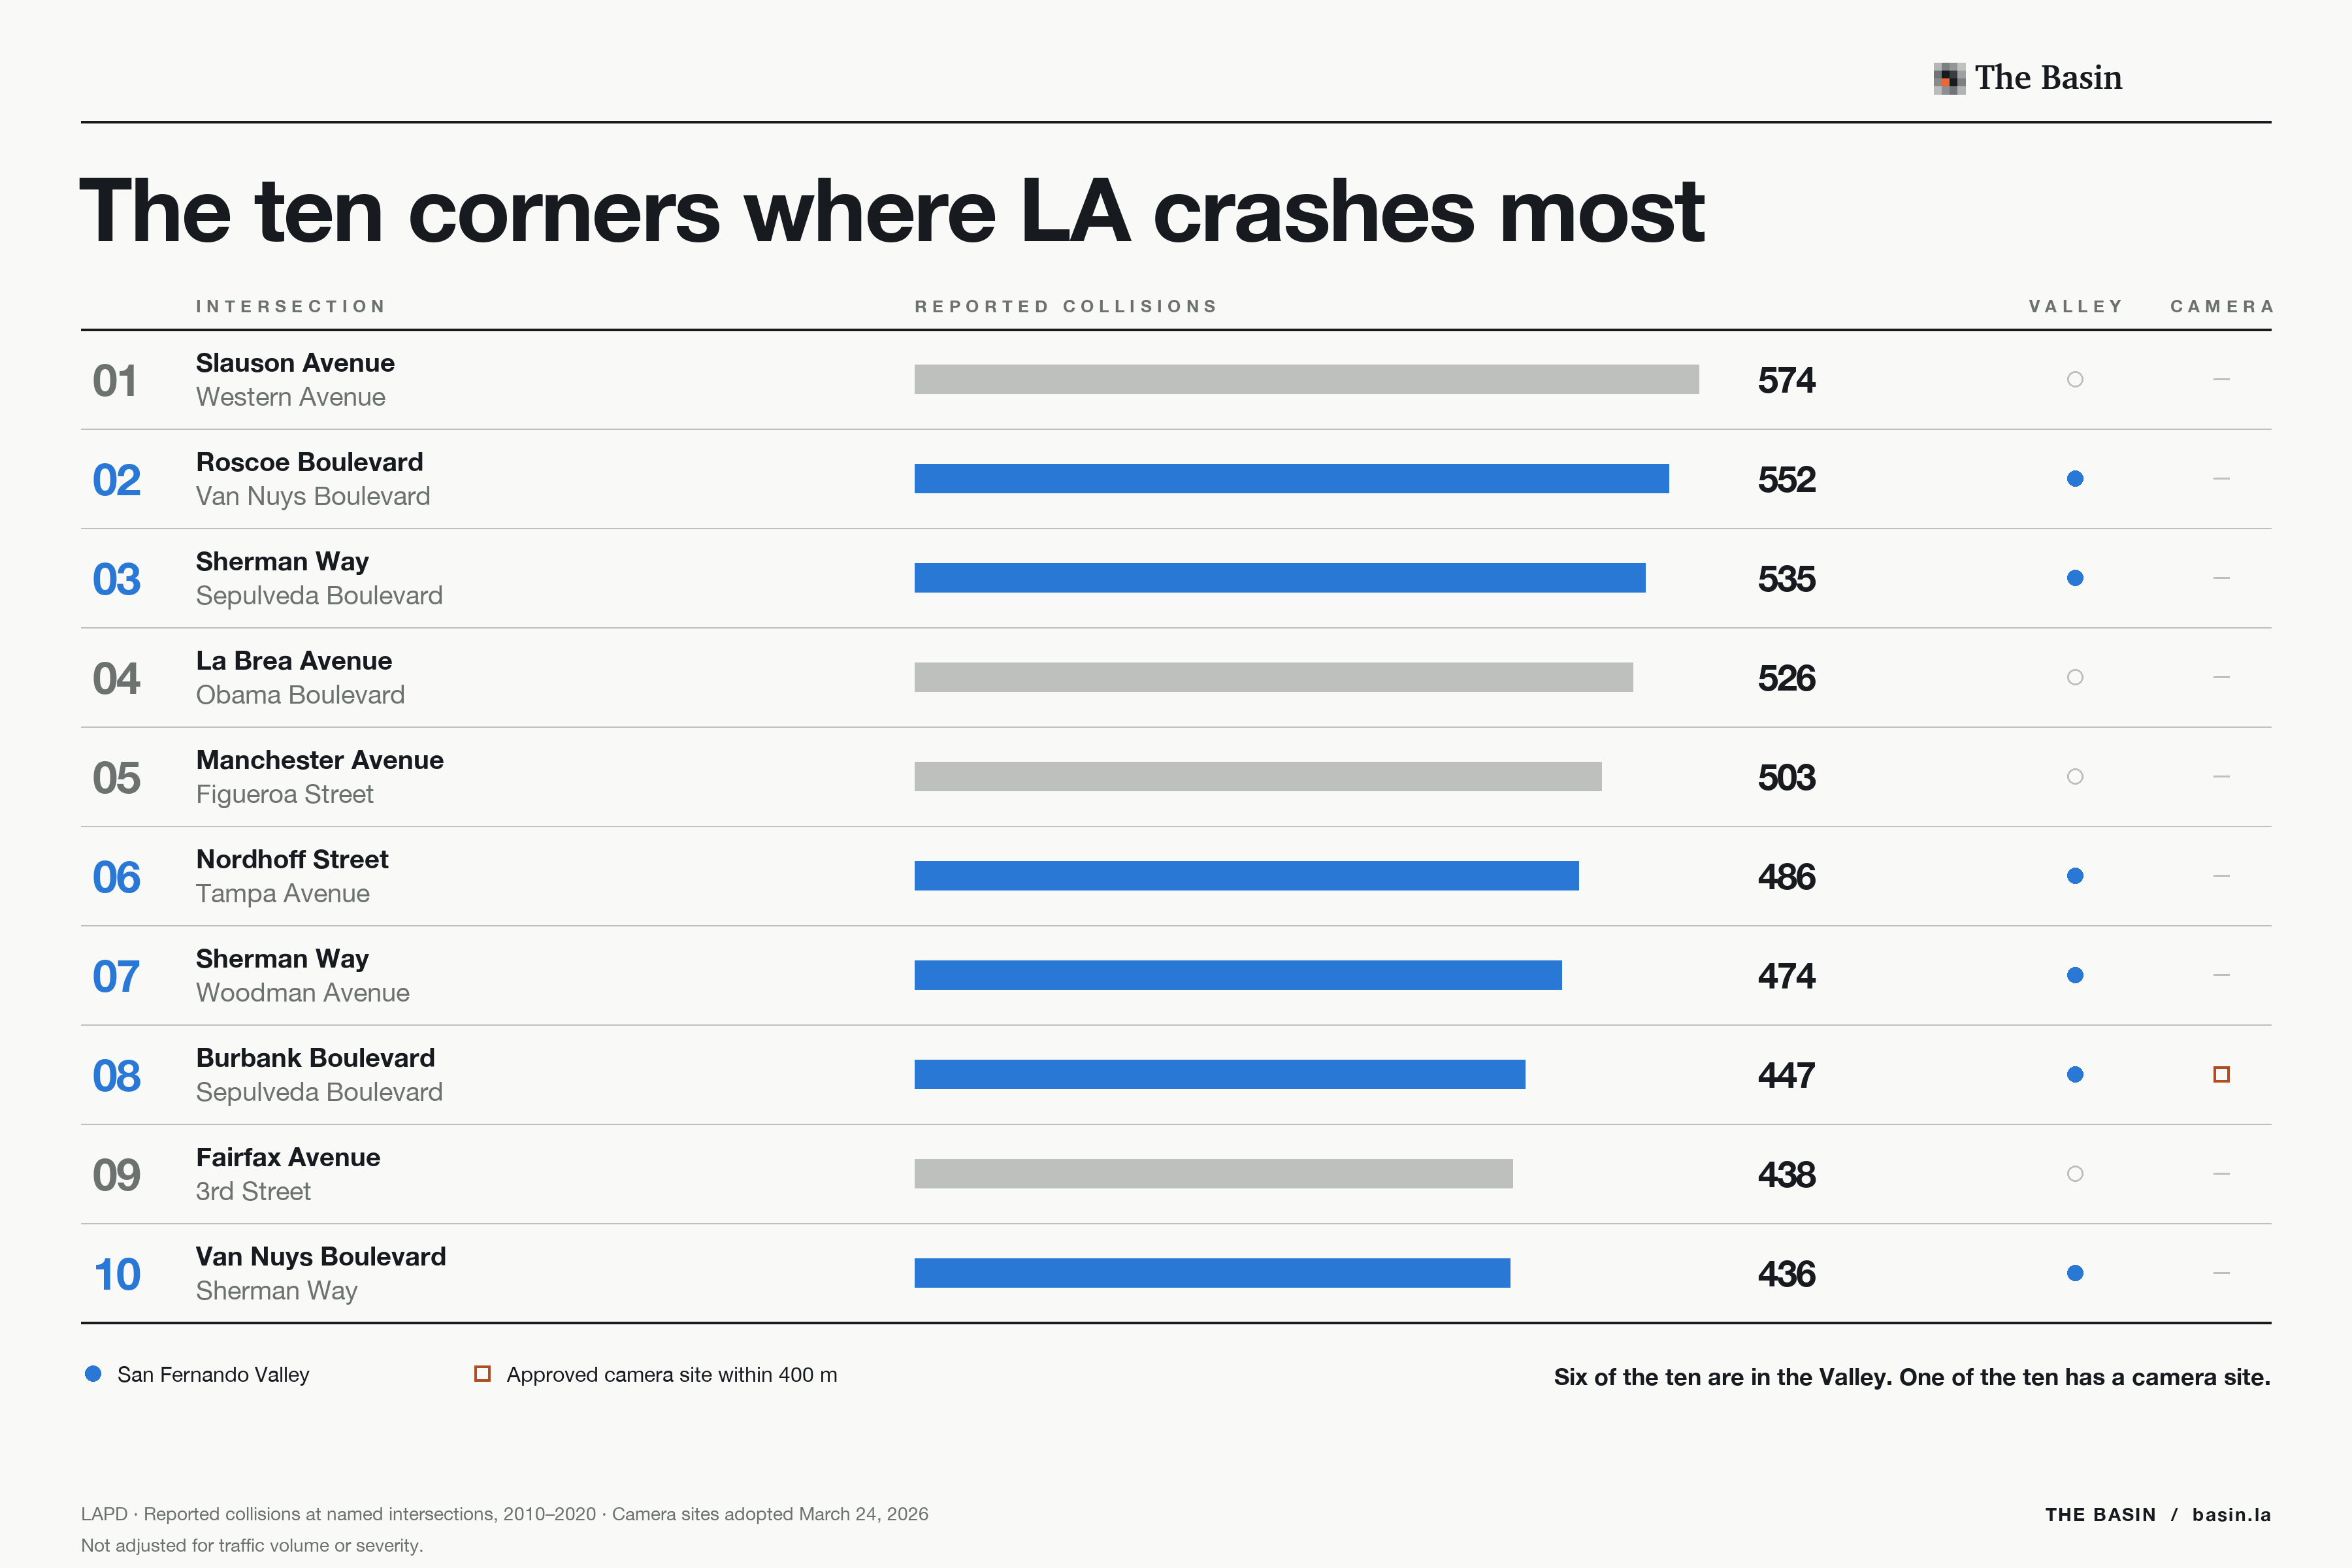
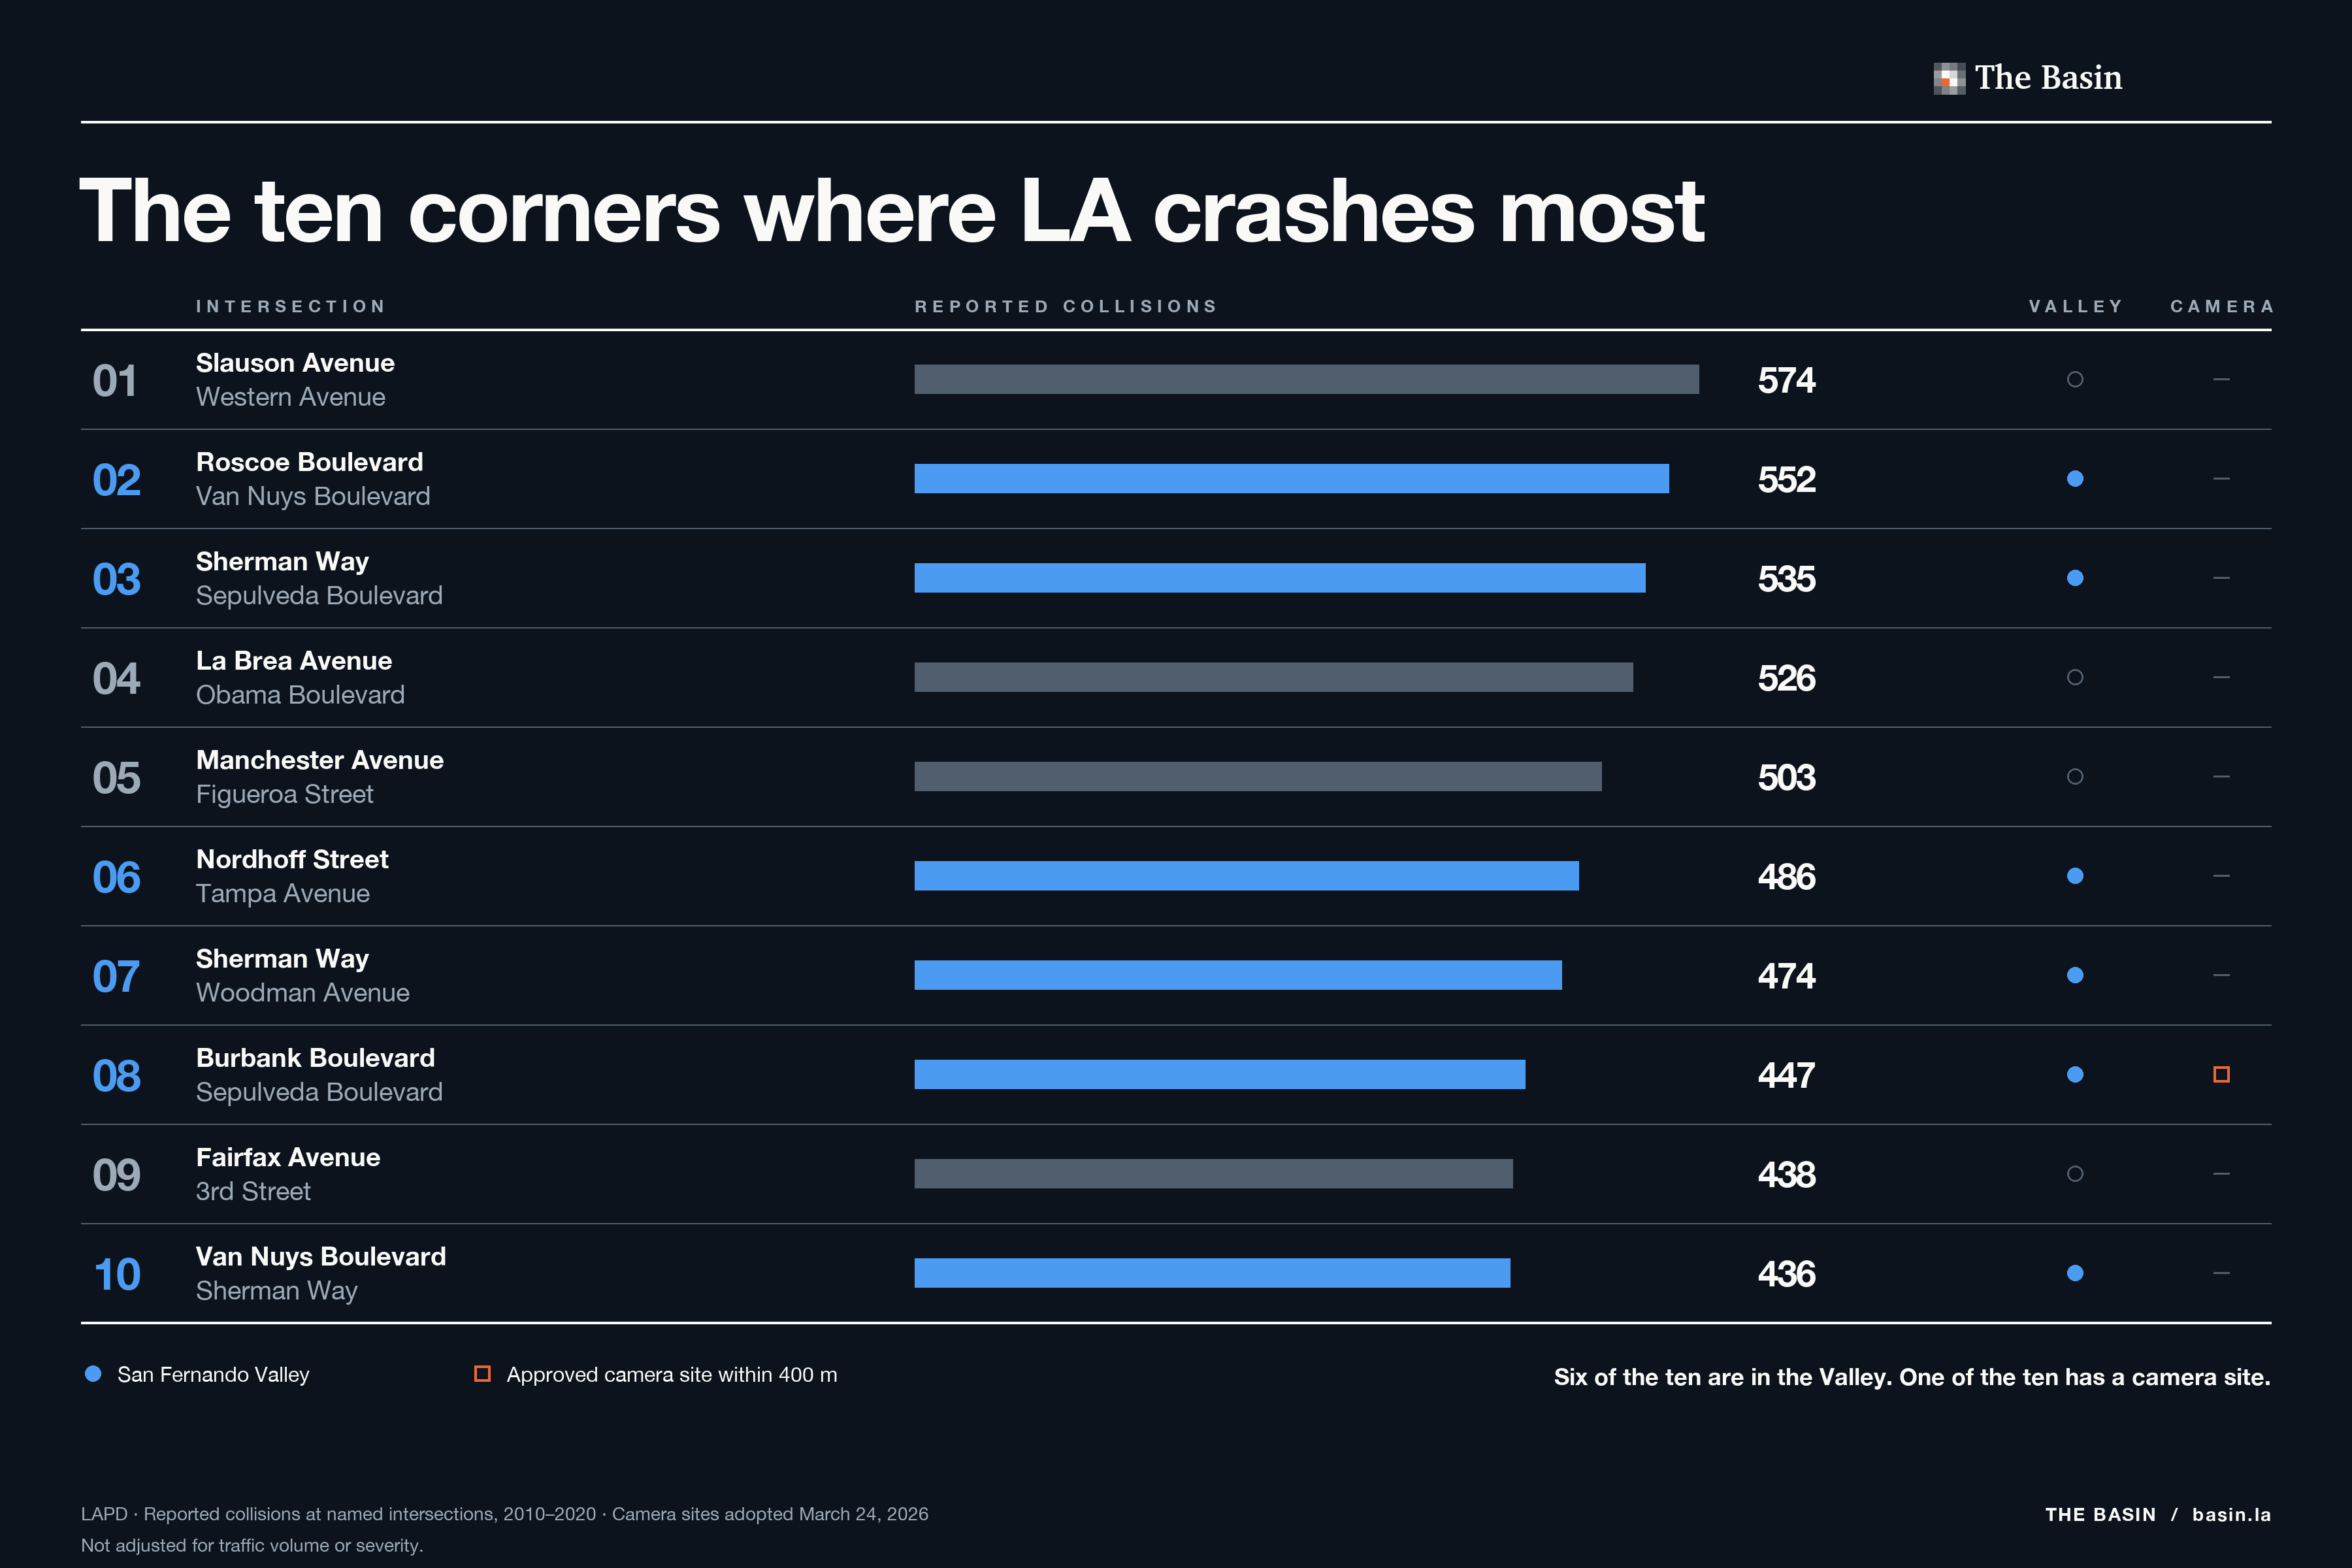
Some of the Valley's presence is simply size. Its neighborhoods contain 44.4 percent of the city's intersections, so a substantial share of the list should be there. But they account for 60 percent of the top ten, falling to 46 percent of the top hundred and 30.4 percent of the top 3,000.
Sepulveda, Sherman Way and Van Nuys Boulevard all appear more than once. Across Van Nuys and the surrounding Valley, wide arterials carry traffic through large signalized crossings.
Camera allocation
On March 24, 2026, the Council approved 125 sites for 250 speed cameras. Every district received eight or nine sites, regardless of how many high-collision intersections it contained.
Imelda Padilla's District 6 contains three of the ten highest-collision intersections and fourteen of the top hundred, behind only Heather Hutt's District 10 at fifteen. Both received nine sites. John Lee's District 12 received eight, leaving one camera for every 422 intersections, the thinnest coverage in the city by that measure.
Those districts, together with Adrin Nazarian's District 2, Bob Blumenfield's District 3 and Monica Rodriguez's District 7, make up the five entirely Valley districts. They contain 40 of the top hundred intersections and received 41 of the 125 sites.
Citywide, only eighteen of the hundred highest-collision intersections have an approved site within 400 meters. Just one of the top ten does, Burbank and Sepulveda, which is in the Valley.
A nearby site doesn't necessarily cover the intersection itself. We count straight-line distance, so a camera on another road can qualify. That makes eighteen an upper bound on coverage of these corners.
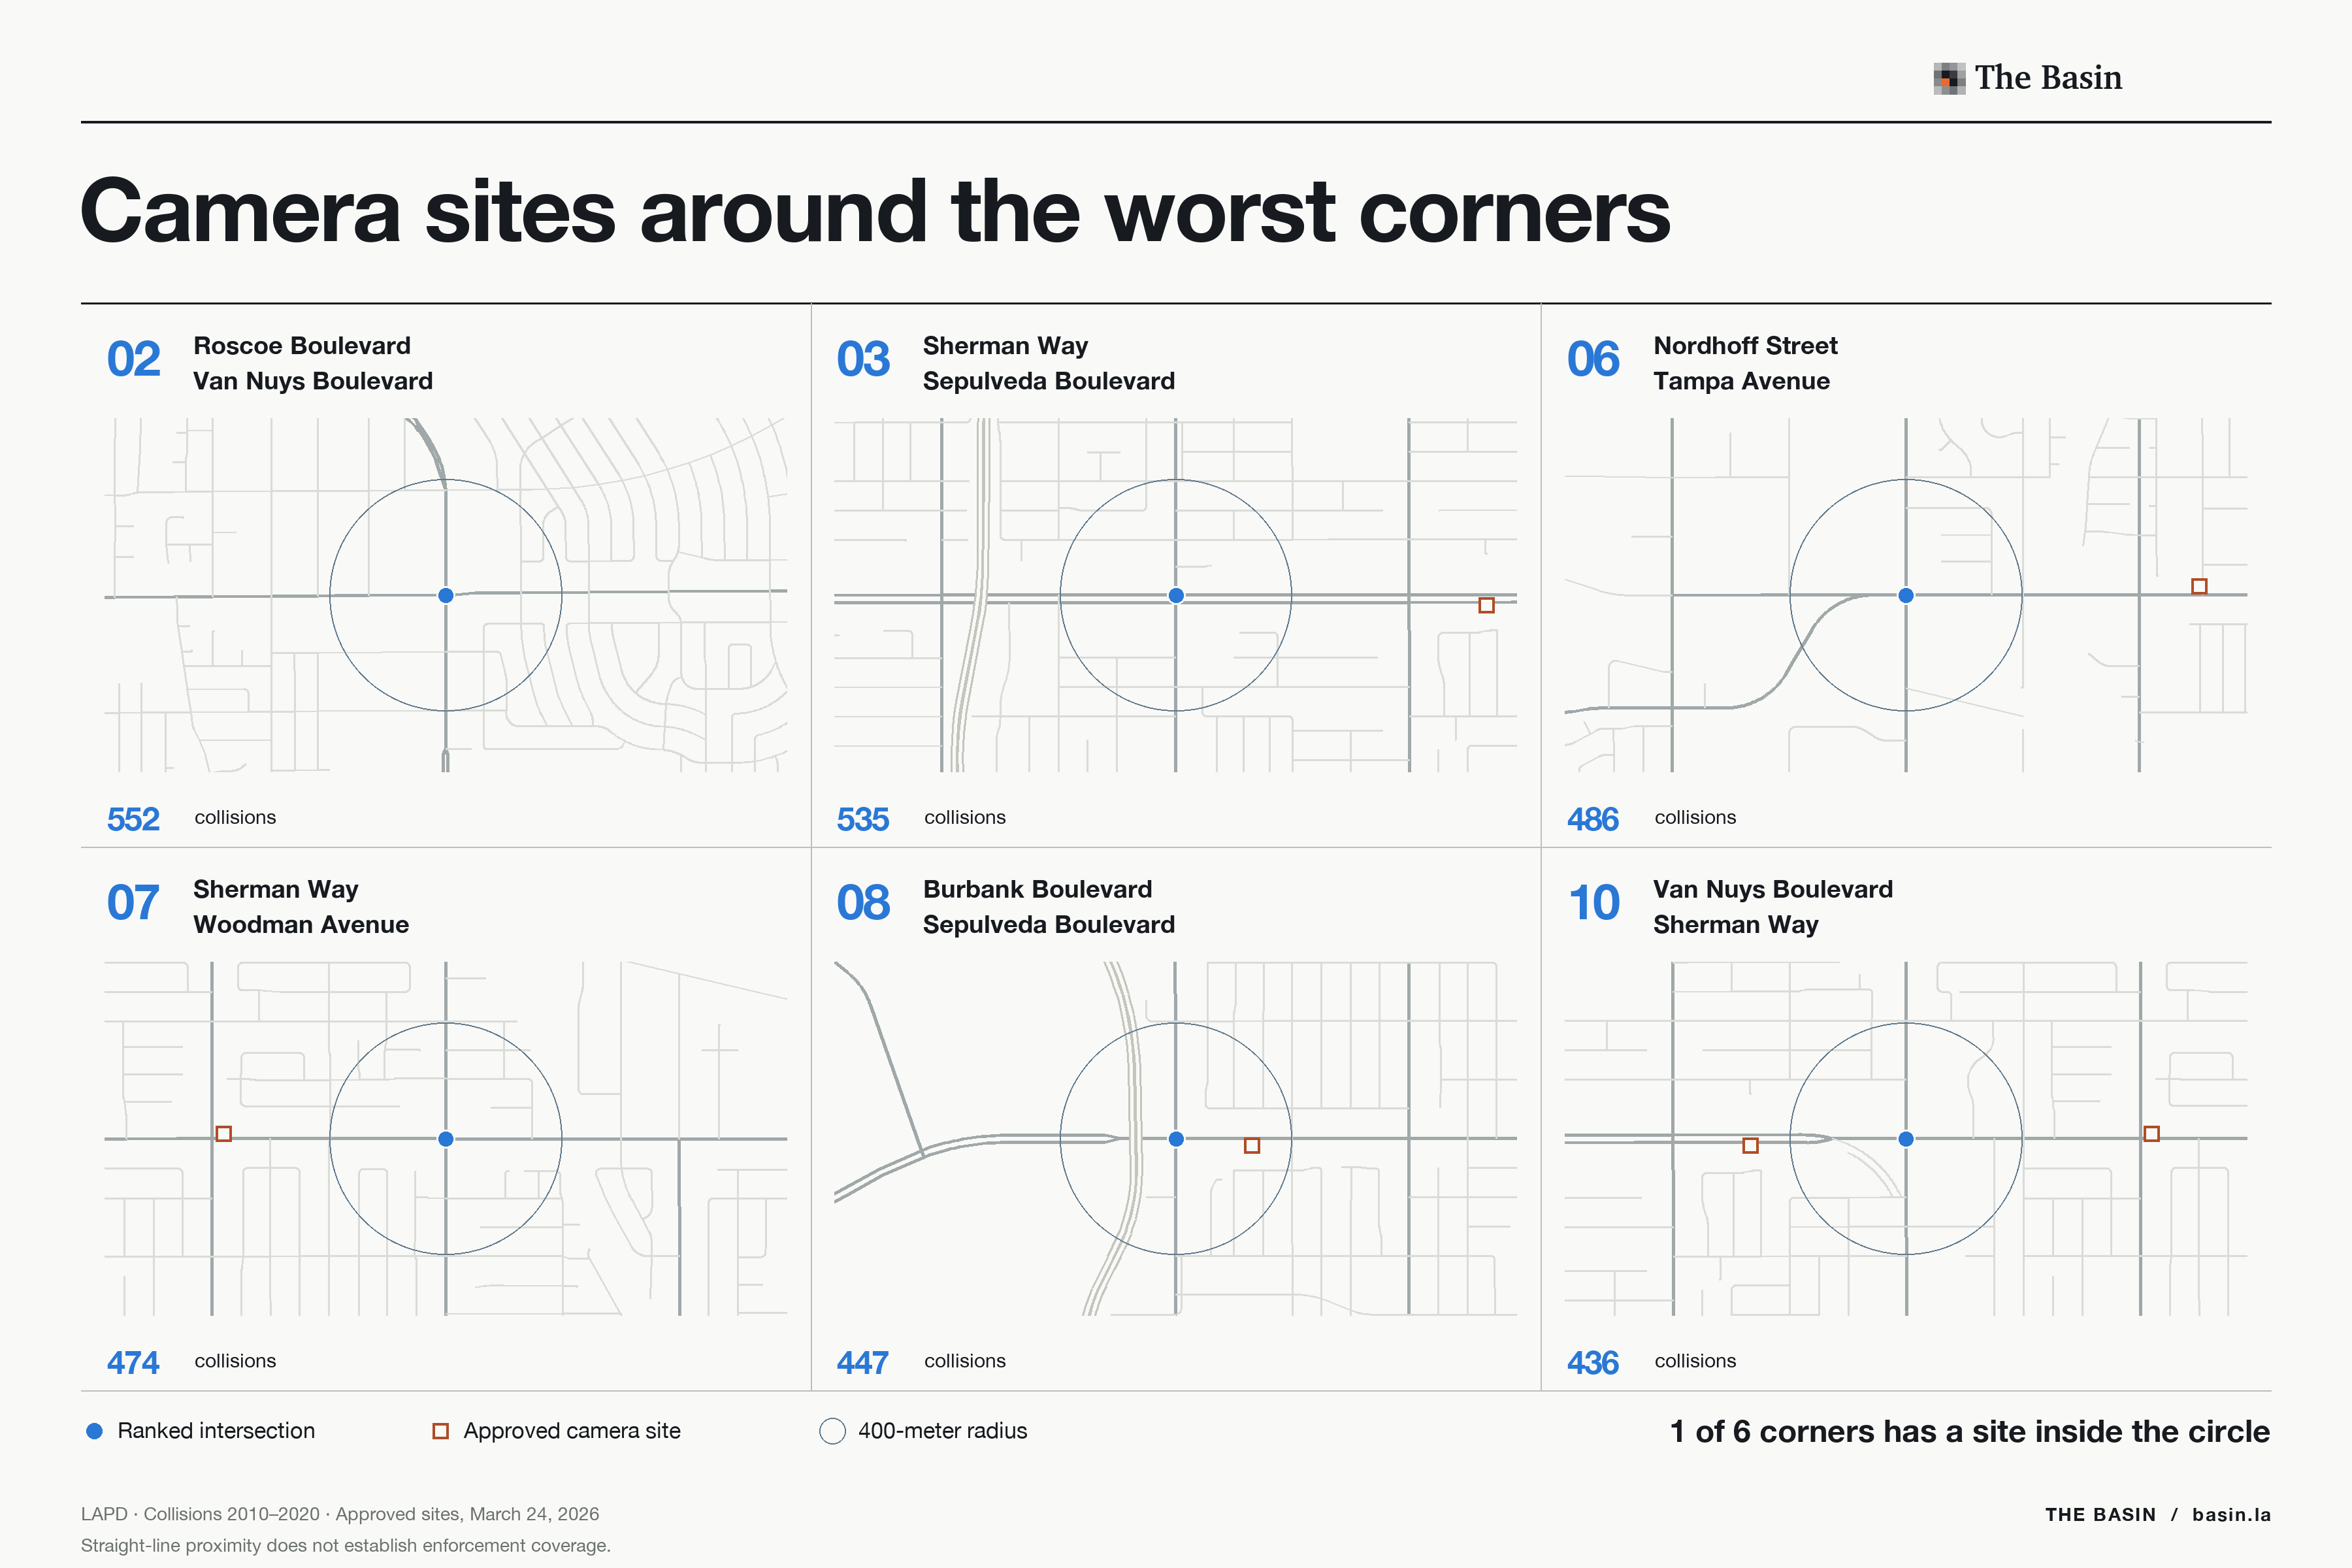
Crash counts aren't the only reason to place a speed camera, and the cameras are intended to slow corridors. But the near-equal allocation by district leaves little room for the concentration visible here.
The city has heard this argument before, from its own auditor. In September 2010 the Controller, Wendy Greuel, audited the photo red light program, the 32-camera system Los Angeles had run since 2006. Her finding was not that the cameras failed to work. It was that they were in the wrong places, and that the city had put them there on purpose.
"It appears that the red light cameras were not necessarily installed at the City's most dangerous intersections," the audit said. "In fact, the methodology used to select the intersections actually excluded some of the highest risk intersections. This included allowing for at least one red light camera per Council District."
The Council shut that program down the following July, voting 13 to 0, and the cameras went dark on July 31, 2011. California did not allow automated speed enforcement at all until AB 645 passed in 2023. When the city came back to the idea, it divided the cameras between council districts again.
Collisions and deaths
The Valley's dominance of this list doesn't make it the city's deadliest region. In fact, the population comparisons run in the other direction.
Over 2010–2020, the five entirely Valley districts recorded 119 collisions per 1,000 residents, compared with 154 in the eight entirely non-Valley districts. Fatal crashes over 2012–2020 came to 50.7 per 100,000 residents in the Valley and 55.6 outside it. Both comparisons exclude the split districts, 4 and 5.
District 14 recorded 46,357 collisions, the second-highest district total, but had only one intersection in the top hundred. Downtown's dense grid spreads crashes among many smaller junctions, so a district can accumulate an enormous collision total without producing more than one corner near the top of the ranking.
The Valley's large crossings repeatedly concentrated collisions, but most of the worst ones have no approved site nearby. All of this begs the question: Why give every district roughly the same number of camera sites when their crash records are so different?
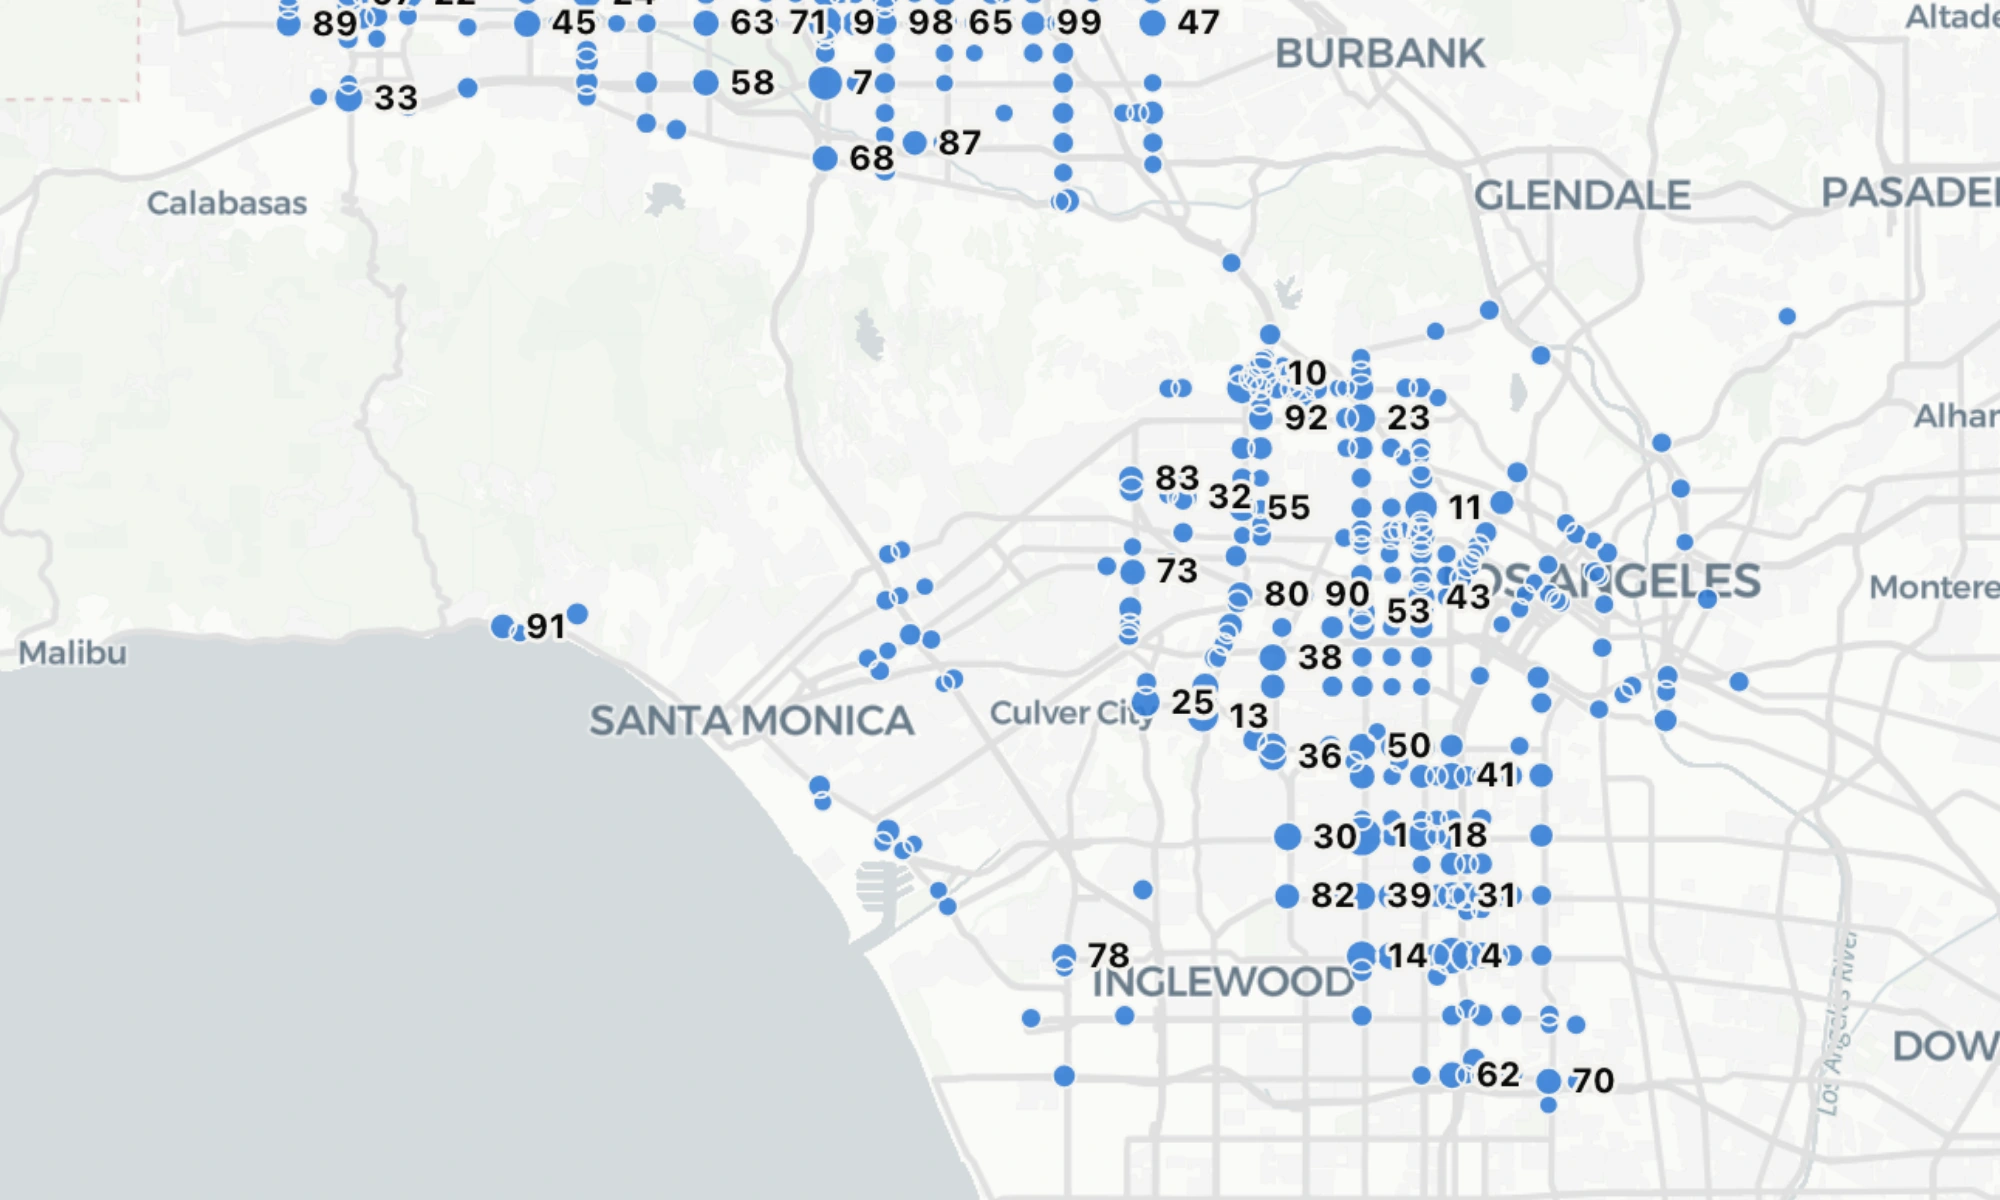
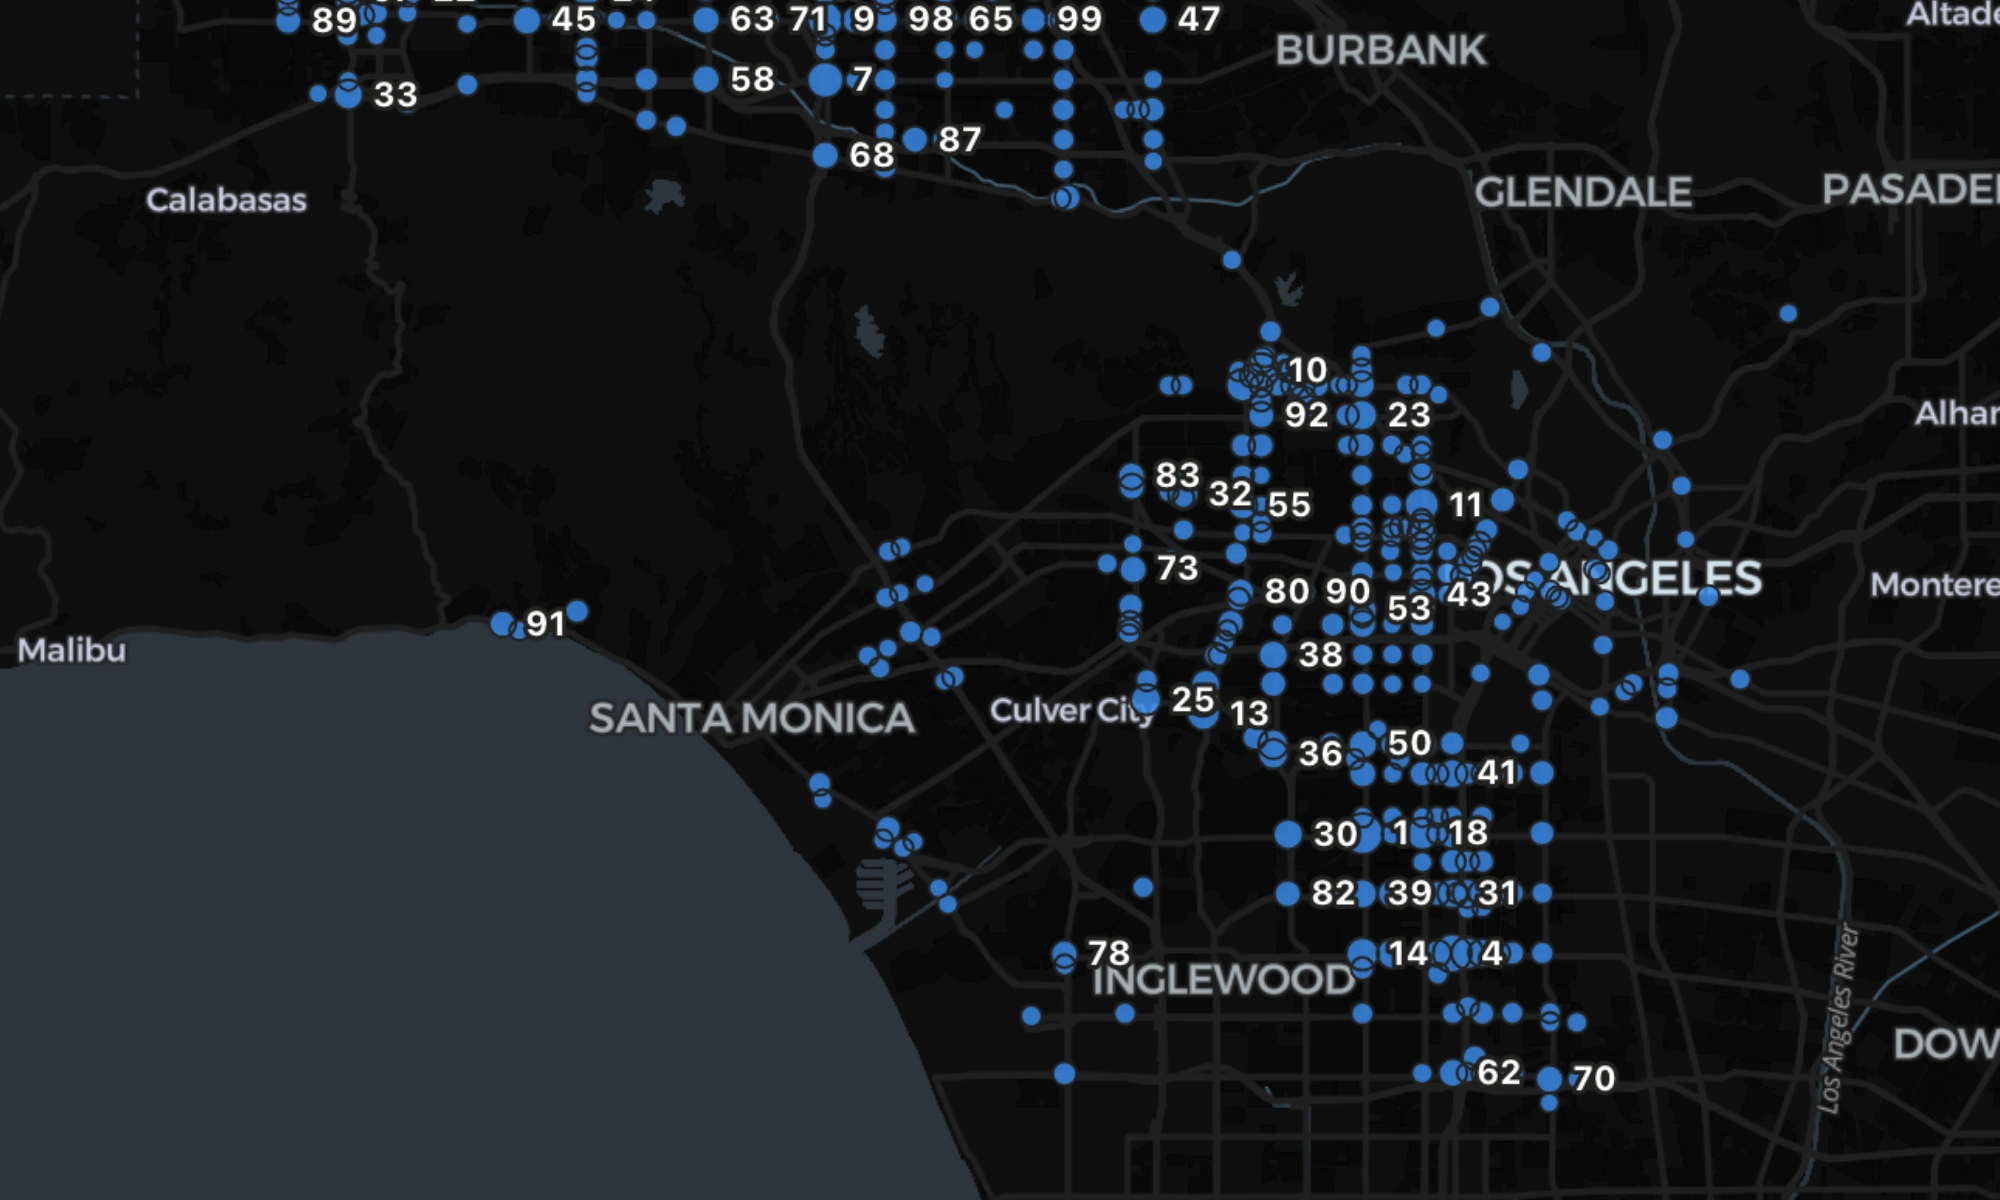 LA's Worst IntersectionsOpen the interactive map
Methods
Rankings use LAPD collision reports from 2010–2020, matched to intersections primarily by street names. Reports that couldn't be placed are excluded.
Camera comparisons use the 125 sites adopted March 24, 2026. A site within 400 meters indicates proximity, not confirmed enforcement coverage or operation. Death counts use NHTSA FARS records for 2021–2024, assigned to council districts by coordinates, and count people killed separately from fatal crashes.