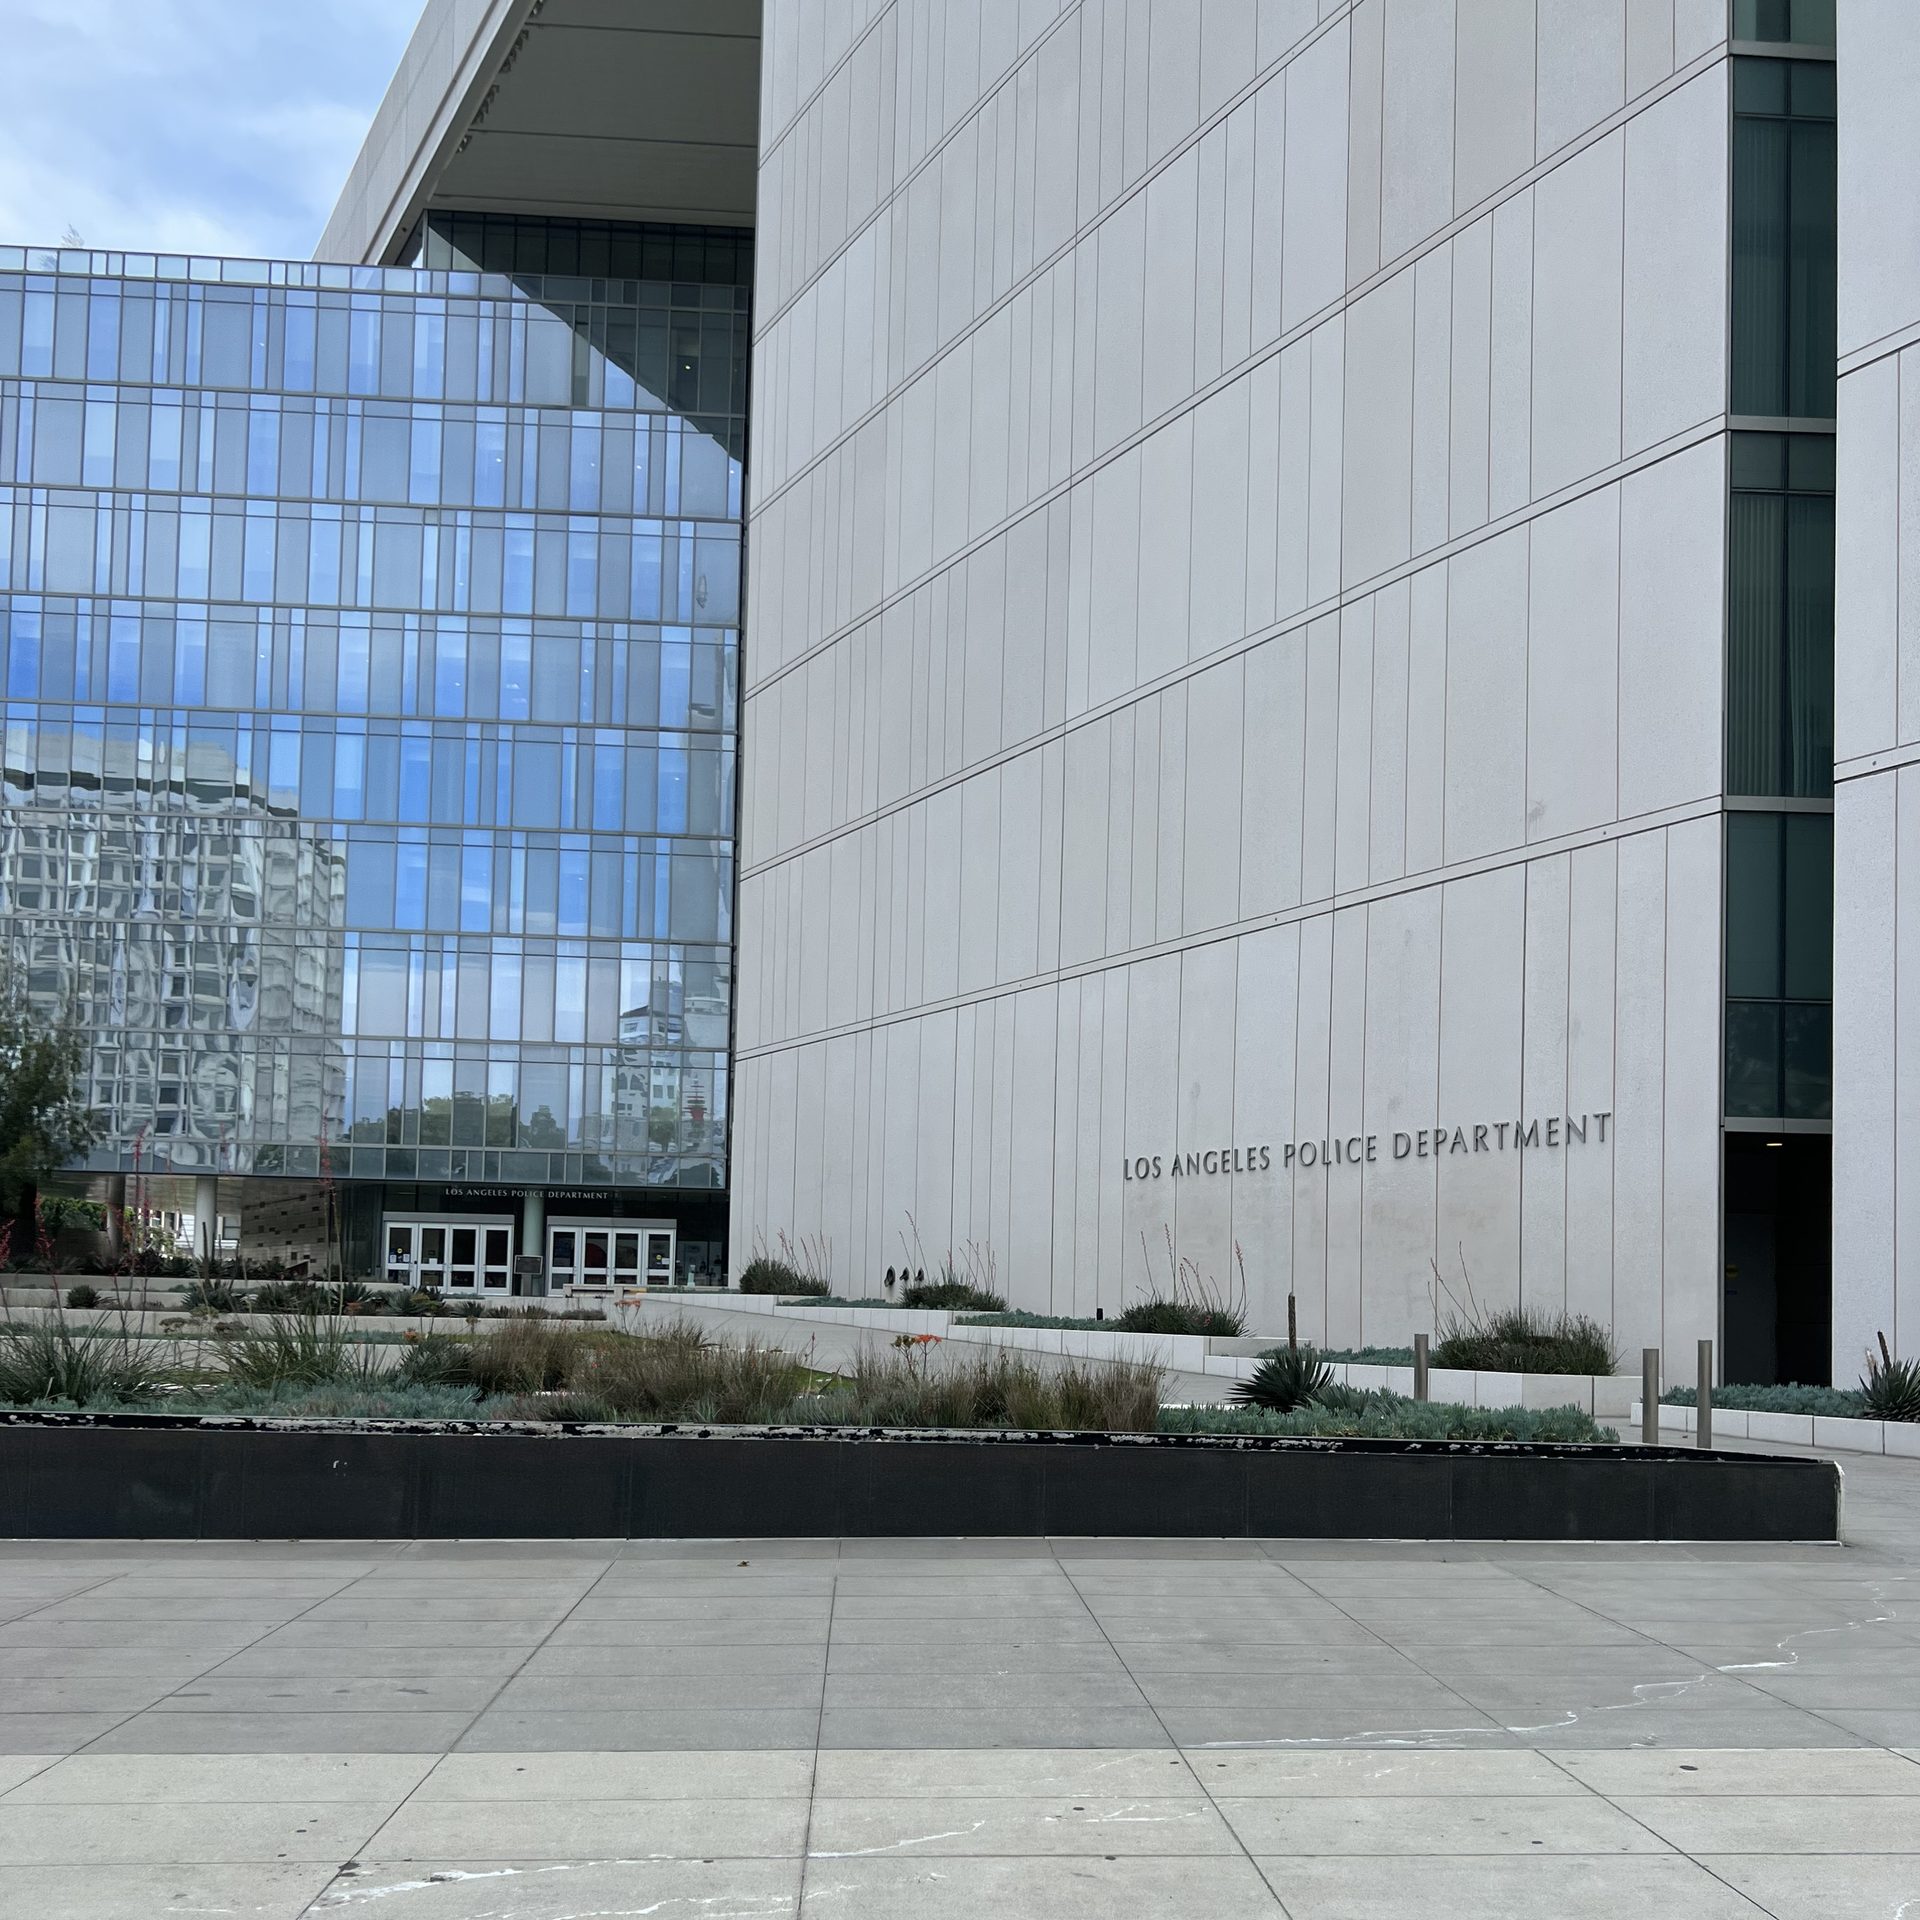
The Los Angeles Police Department let its contract with Flock Safety expire in July 2026. The department's chief information officer, Dean Gialamas, told reporters the sticking point was who owns the data once the cameras collect it, and the department cited "serious concerns around civil liberties and civil rights issues." On 14 July the Board of Police Commissioners voted to suspend deployment pending more oversight and public input. A motion from Councilmember Ysabel Jurado, introduced in late May, had already asked the commission not to sign anything further with the company.
None of that turned a camera off. Flock owns and operates its equipment, the cameras kept recording into the company's cloud, and the agreement that lapsed governed the LAPD's access to the data rather than the operation of the readers. It also never covered the larger part of the network. The cameras on city property number 138. The ones bolted to apartment complexes, homeowners' associations and private developments are a separate and larger population that no city contract reaches.
The other eighty-seven cities in Los Angeles County are on the same map.
What the map shows
There is no public register of license plate readers in Los Angeles County. What exists instead is OpenStreetMap, where volunteers organized through a project called DeFlock have been photographing readers and tagging their locations for about two years. We pulled every reader tagged in a box drawn around the county, put each one inside a Census city boundary, and joined the result to Census population and land area.
That produced 3,127 mapped readers inside the county's 88 incorporated cities, of which 2,190 carry a manufacturer tag naming Flock Safety. Another 2,164 sit outside all 88 city limits, in unincorporated county or across a county line. Motorola Solutions is the second vendor at 406 readers, and about one mapped reader in nine carries no vendor tag at all. Those untagged readers are counted separately rather than folded into Flock, which makes every Flock number here a floor rather than an estimate.
Seventy-nine of the 88 cities have at least one mapped Flock reader. Four have no mapped reader of any kind: Avalon, Bradbury, Maywood and Sierra Madre.
Per square mile
| City | Flock cameras | Land sq mi | Per sq mi | Per 10k residents |
|---|---|---|---|---|
| West Hollywood | 45 | 1.89 | 23.8 | 13.2 |
| San Fernando | 40 | 2.37 | 16.9 | 17.1 |
| La Puente | 54 | 3.48 | 15.5 | 14.8 |
| Beverly Hills | 67 | 5.71 | 11.7 | 21.8 |
| Hawaiian Gardens | 11 | 0.94 | 11.6 | 8.2 |
| San Marino | 39 | 3.77 | 10.4 | 32.6 |
| Culver City | 37 | 5.11 | 7.2 | 9.4 |
| Alhambra | 51 | 7.63 | 6.7 | 6.4 |
| South Pasadena | 20 | 3.41 | 5.9 | 7.8 |
| Hermosa Beach | 8 | 1.43 | 5.6 | 4.3 |
| Santa Monica | 47 | 8.41 | 5.6 | 5.2 |
| Baldwin Park | 37 | 6.63 | 5.6 | 5.4 |
| Bell Gardens | 13 | 2.46 | 5.3 | 3.5 |
| Compton | 47 | 10.03 | 4.7 | 5.2 |
| Paramount | 22 | 4.73 | 4.7 | 4.3 |
| Santa Fe Springs | 41 | 8.86 | 4.6 | 21.8 |
| La Cañada Flintridge | 36 | 8.63 | 4.2 | 18.5 |
| San Gabriel | 17 | 4.14 | 4.1 | 4.5 |
| Arcadia | 42 | 10.93 | 3.8 | 7.8 |
| Lakewood | 35 | 9.39 | 3.7 | 4.5 |
| Los Angeles | 305 | 470.5 | 0.65 | 0.8 |
West Hollywood has thirty-seven times the mapped Flock camera density of Los Angeles
Flock cameras per square mile of land, the twenty densest cities in Los Angeles County, with the City of Los Angeles for scale.
West Hollywood has a mapped Flock reader for every 27 acres. The City of Los Angeles has one for every square mile and a half. That is a ratio of about thirty-seven to one, and it holds up in the direction that matters: Los Angeles ranks 67th of 88 cities on readers per square mile, and 71st on readers per resident. The city holding 40 percent of the county's population is in the bottom quarter of its own county on both measures.
The 305 readers mapped inside Los Angeles are more than twice the 138 the department says sit on city property. The gap is the private network.
Mapped density does not track city income
Mapped camera density is high in cities across the income range. Beverly Hills and San Marino are in the top six, and so are San Fernando, La Puente and Hawaiian Gardens. Baldwin Park, Bell Gardens, Compton and Paramount all sit above the county median for reader density, and so do Santa Monica and La Cañada Flintridge. Both ends of the county's income range are near the top of this list and both are near the bottom of it.
What the top of the list does have in common is size. Nineteen of the twenty densest cities are under eleven square miles. A small city can ring its own perimeter with a few dozen cameras, and a few dozen cameras across two square miles is a high density. Matching West Hollywood's density across 470 square miles would take roughly eleven thousand readers.
Per resident, the ranking changes
Per square mile and per resident are not two views of the same ranking. They disagree, and where they disagree hardest is instructive.
| City | Residents | Flock cameras | Per 10k residents | Per sq mi |
|---|---|---|---|---|
| Industry | 199 | 11 | 552.8 | 0.9 |
| Vernon | 207 | 9 | 434.8 | 1.8 |
| Irwindale | 1,439 | 12 | 83.4 | 1.4 |
| San Marino | 11,964 | 39 | 32.6 | 10.4 |
| Santa Fe Springs | 18,793 | 41 | 21.8 | 4.6 |
| Beverly Hills | 30,764 | 67 | 21.8 | 11.7 |
| Westlake Village | 7,505 | 14 | 18.6 | 2.7 |
| La Cañada Flintridge | 19,480 | 36 | 18.5 | 4.2 |
| Los Angeles | 3,869,089 | 305 | 0.8 | 0.65 |
Per resident, the top three are cities where almost nobody lives
Flock cameras per 10,000 residents against city population, the 79 Los Angeles County cities with at least one mapped Flock camera
The top of the per-resident ranking is three industrial cities. Industry has 199 residents. Vernon has 207. Irwindale has 1,439. These are manufacturing and warehouse districts that were incorporated to be workplaces, and their daytime populations run to tens of thousands of people who live somewhere else. A per-resident rate in Industry is not measuring how closely Industry watches its residents. It is dividing a real numerator by a denominator that describes almost nobody.
Per capita is the usual denominator for civic data, and here it produces a ranking whose top three entries are an artifact of incorporation law. Per square mile has its own bias, in the opposite direction: it rewards small cities and buries large ones. Neither is wrong; they answer different questions. We publish both and say which one we are leaning on.
What a city contract does not reach
The City of Los Angeles is the only jurisdiction in the county that has publicly reopened the question of whether it should be in this network at all. It is also, on this evidence, one of the least covered places in the county to begin with. Its contract fight is over data governing 138 city-property cameras in a county with several thousand mapped readers, most of them owned by somebody else and most of them outside its jurisdiction.
Those readers are not a single system. Of the 3,127 mapped inside city limits, 2,190 carry a Flock Safety tag, 406 are Motorola Solutions, and about one in nine carries no vendor tag at all. Flock operates a network its customer agencies can search across; what sharing exists between vendors is not something this data establishes, and we have not tried to establish it here.
Many routes out of Los Angeles pass into cities with denser mapped reader coverage, under agreements no Los Angeles city contract governs.