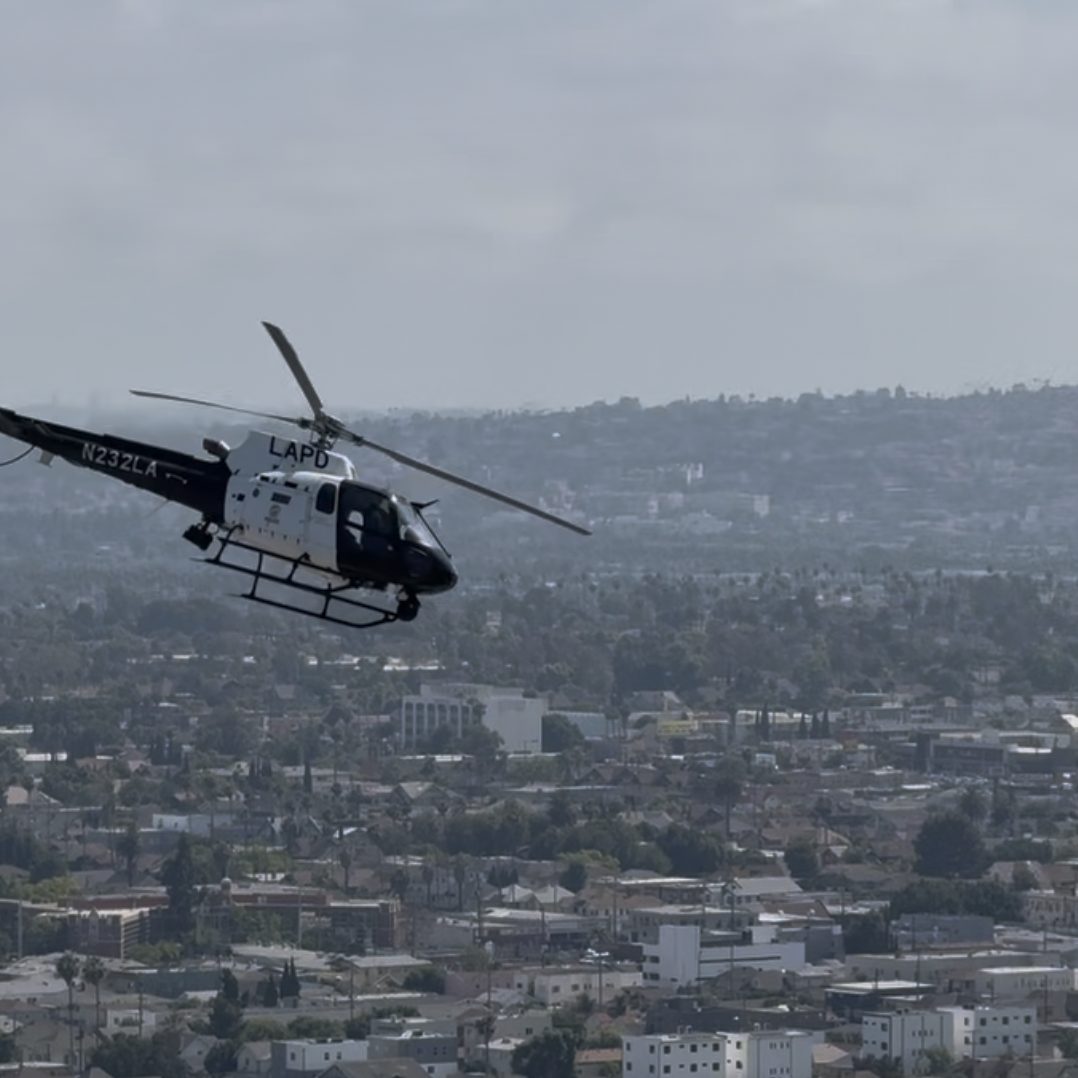
The Los Angeles Police Department operates the largest municipal police air fleet in the United States. Its helicopters broadcast their locations through ADS-B transponders, and a volunteer network of receivers around the region records those signals.
I collected one year of those broadcasts, from August 16, 2025, through August 15, 2026. After cleaning, the dataset contains 20,886,139 positions from 17 registered LAPD helicopters. Sixteen were observed flying during the year.
Those positions divide into 8,967 flights and 12,828 observed aircraft-hours. At the City Controller's estimate of $2,916 per flight hour, that represents about $37.4 million in flying.
The data is not an official LAPD flight log. It records positions received by community-operated antennas, so some flights and portions of flights will be missing. But the volume is large enough to show where the fleet spends its time and how that activity changes over the course of a day.
Draw the positions without a basemap and Los Angeles still becomes visible. Freeways and common flight corridors emerge from repeated tracks. Some neighborhoods fill in brightly because helicopters cross or circle above them again and again. Other areas receive much less observed time.
Half the time falls on a fifth of the ground
Helicopter time is concentrated in a relatively small part of the region.
Across the 2,495 census tracts in the analysis, half of all observed time overhead falls on 277. Those tracts make up 11.1 percent of the total and cover 19.4 percent of the land. The top five percent of tracts receive 30.8 percent of the observed time while occupying 3.4 percent of the ground.
Measured per square kilometer, the most heavily overflown neighborhoods are Chinatown, Westlake, Pico-Union and Downtown. Chinatown receives about 63 hours of observed helicopter time per square kilometer over the year. Westlake receives 55, Pico-Union 50 and Downtown 48.
Chinatown gets sixty-two hours of helicopter overhead per square kilometer
Observed hours in the air above each square kilometer, the fourteen most heavily overflown neighborhoods in the year to 15 August 2026.
Raw hours produce a slightly different ranking because larger neighborhoods have more ground over which to accumulate time. Downtown leads with 727 observed hours, followed by Boyle Heights with 403, Westlake with 388 and Hollywood with 357. Van Nuys records 273 hours and Koreatown 251.
These totals include all observed airborne time over a place. A helicopter crossing a neighborhood on its way elsewhere counts as time overhead, just as one circling there does.
Those are different things to be under, which is why the data also identifies orbiting.
An orbit is a section of a flight that meets a consistent geometric test. The helicopter must remain within 1.5 kilometers of a central point for at least 90 seconds, change direction by at least a full 360 degrees, average less than 80 knots and remain below 2,500 feet above the ground.
The path does not need to form a perfect circle. It can be wide, irregular or elongated as long as it meets those conditions.
"Orbiting time" is the observed time contained in those qualifying sections of a track. It describes how the aircraft moved, not why it was there. The flight data cannot show whether a helicopter was responding to a call, searching for someone, assisting officers, training or performing some other task.
The income gap is large, but density explains most of it
When census tracts are divided into fifths by median household income, the poorest fifth receives a median of 730 minutes of helicopter time per square kilometer and the richest fifth 16 minutes, a 46-fold difference.
The poorest fifth of the city draws forty-six times the helicopter time of the richest
Median observed minutes overhead per square kilometer, census tracts grouped by median household income.
Much of that gap reflects population density. Lower-income parts of Los Angeles tend to place more residents, buildings and activity into each square kilometer. A measure based on land area will therefore produce larger values in dense neighborhoods even when the amount of helicopter time per resident is less dramatically different.
Population density has a stronger relationship with helicopter time per square kilometer than income does. The Spearman correlation between density and helicopter time is +0.50. For income, it is -0.36.
When time is measured per thousand residents rather than per square kilometer, the relationship with income falls to -0.19. The difference remains, but it becomes much smaller.
Density does not explain all of it. Among tracts grouped by similar density, the poorer half still recorded more helicopter time: 1.3 times as much among the least dense tracts, 1.5 times in the middle and 3.4 times among the densest.
Circling and passing through are different patterns
Total time overhead does not always indicate sustained activity in a neighborhood. Some districts lie beneath common travel routes between the LAPD's bases and the rest of the city, while others receive a much larger share of circling flight.
In Council District 15, which includes Wilmington and San Pedro, 73 percent of observed helicopter time is classified as orbiting. The share is 66 percent in both District 8 and District 9 in South Los Angeles.
In the harbor districts most helicopter time is spent circling. Over the hills, most of it is passing through.
Share of each council district's observed time overhead that meets the orbiting test, year to 15 August 2026.
Council District 4, which includes parts of the Hollywood Hills, Sherman Oaks and Studio City, records a much lower orbiting share of 32 percent. Districts 12 and 13 are each at about 36 percent.
That makes the same total overhead time mean different things in different places. A district along a frequent travel corridor may record many helicopters moving steadily across it. Another district may record fewer total hours but a larger share spent circling within a confined area.
The classification remains descriptive. Circling is not a record of police activity on the ground, and it should not be read as one. It is simply a way to separate sustained local movement from travel through the area.
The fleet nearly disappears before dawn
The daily schedule is more consistent than the geography.
Measured as wall-clock coverage, the fleet keeps at least one helicopter in the air for about 19 hours of an average day. Activity climbs through the morning and remains relatively steady from around 9 a.m. until after midnight.
At 1 p.m., 2.11 helicopters are airborne on average. At 6 a.m., the average is 0.06.
The fleet flies about nineteen hours a day, then stops for two
Mean number of LAPD helicopters airborne in each hour of the local day, averaged across the year to 15 August 2026.
The decline is concentrated in a short pre-dawn period. Between roughly 5 and 7 a.m., the fleet is almost entirely on the ground. Activity then begins climbing again.
Differences between days of the week are modest by comparison. Tuesday is the busiest and Saturday the quietest, with a spread of about 20 percent. Time of day matters much more than the day itself.
The full year can be explored in The Basin's helicopter map. It includes the accumulated flight tracks as well as a replay showing how those tracks build over time.
The map cannot explain the purpose of an individual flight. What it can show is where helicopter time accumulates, where aircraft tend to circle and where they usually pass through.
The underlying tables and methodology are available through Basin Data. Aircraft positions are derived from community-received ADS-B data provided by Airplanes.live.