
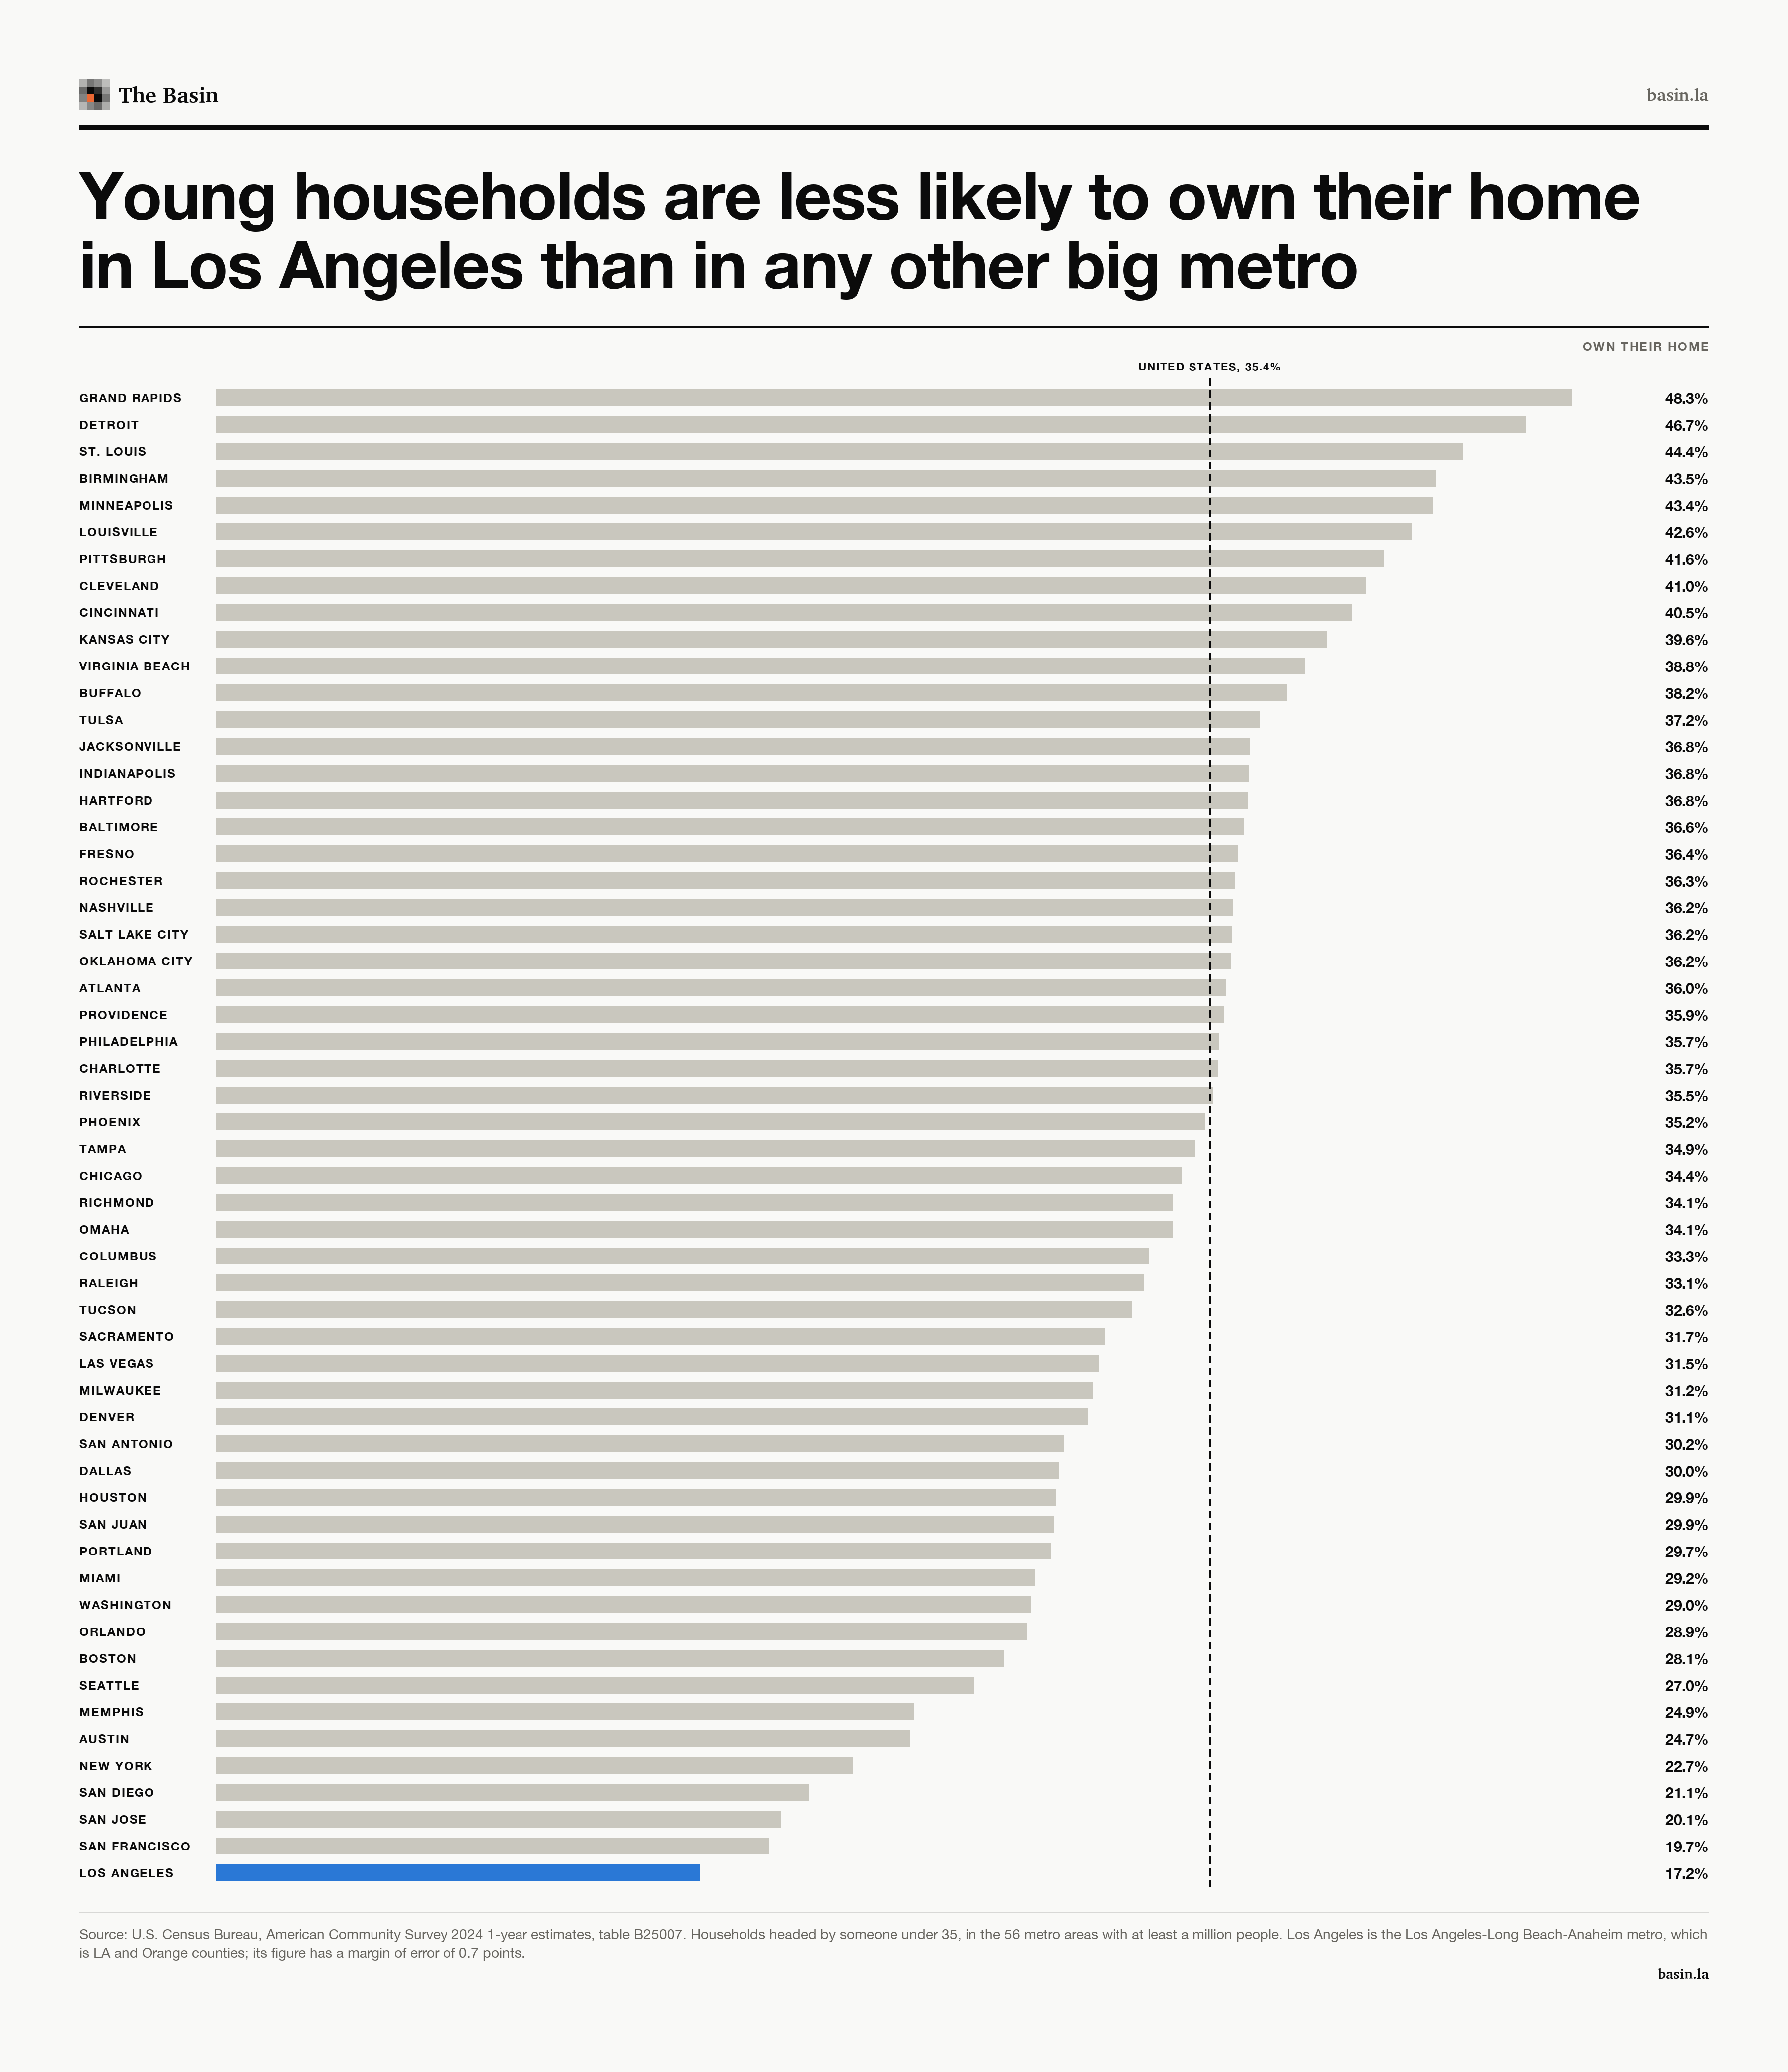
In 2024, 17.2% of households in the Los Angeles area headed by someone under 35 owned their home, according to the Census Bureau’s American Community Survey. That’s the lowest share among the 56 metro areas in the country with at least a million people, and it’s below San Francisco’s 19.7% by more than the survey’s margin of error. Nationally the figure was 35.4%, and in Grand Rapids, Michigan, the highest of the 56, it was 48.3%.
The Los Angeles metro, as the federal government defines it, is Los Angeles and Orange counties. Just above it on the list are San Francisco, San Jose, San Diego and New York, all between 19.7% and 22.7%. The same survey found 40% of the metro’s 18-to-34-year-olds living in a parent’s home, about the same share as New York and among the highest of the 56.


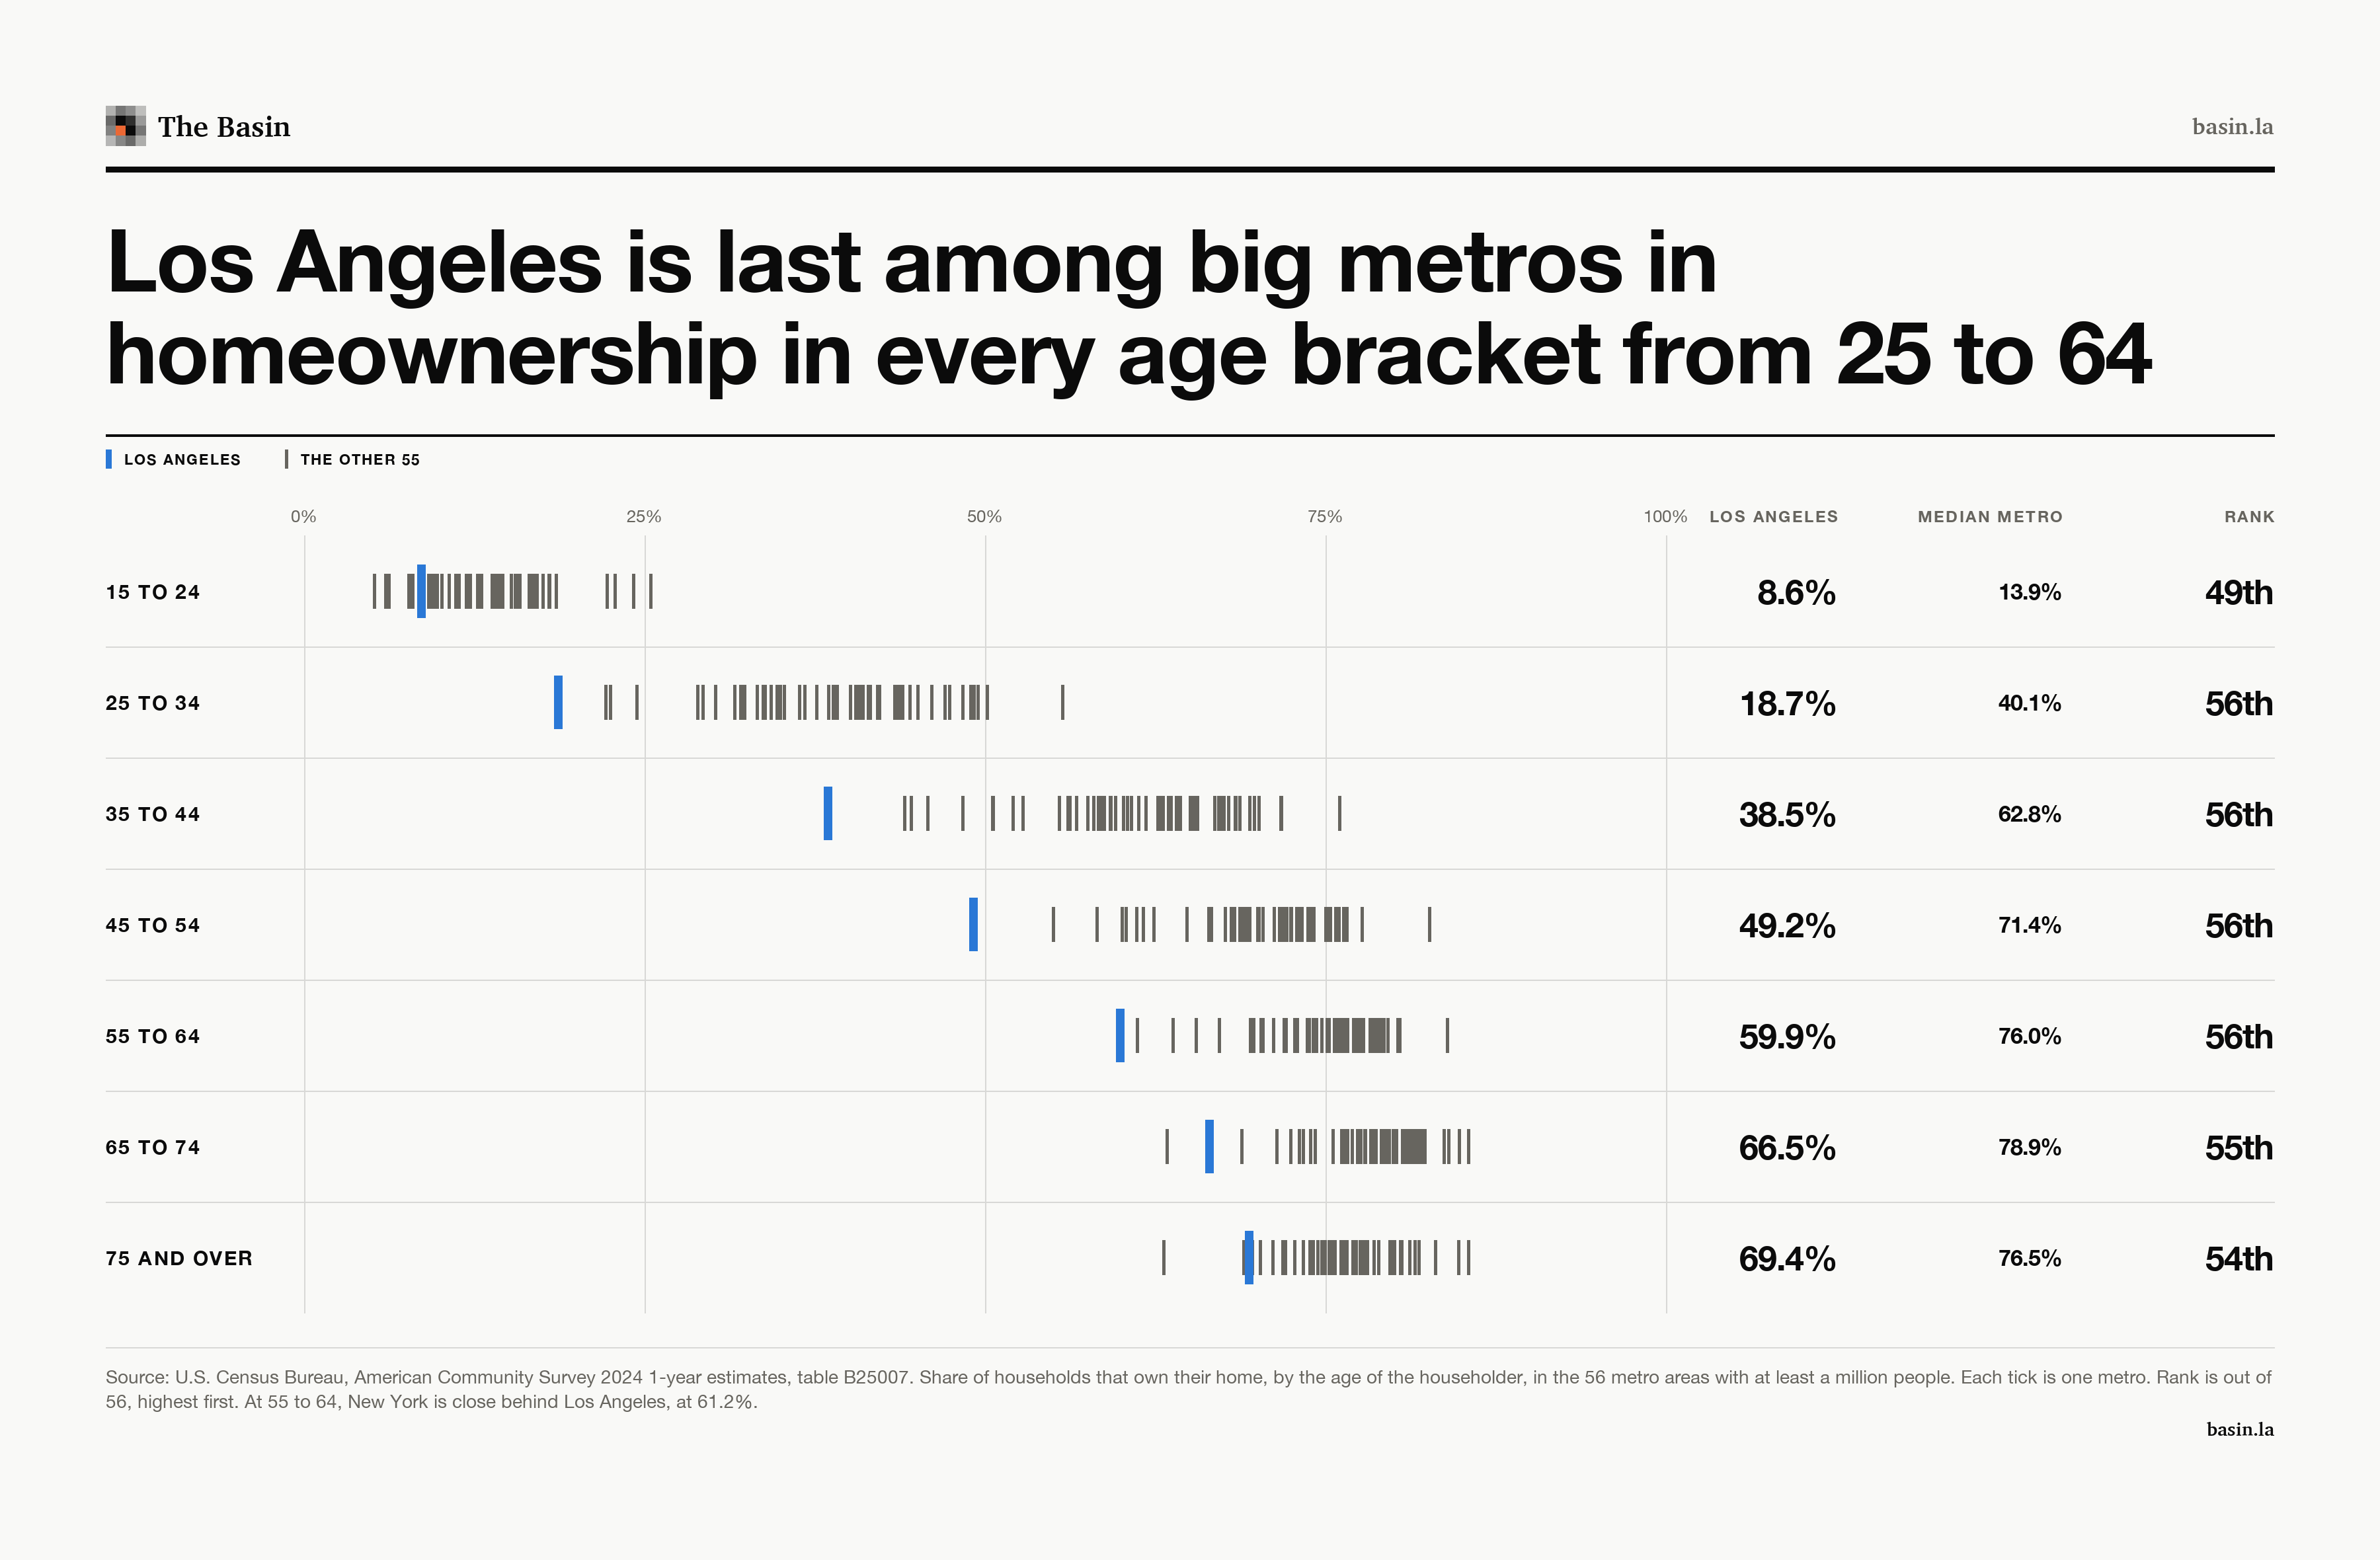
Los Angeles is also last for householders 25 to 34, 35 to 44, 45 to 54 and 55 to 64, and in three of those four brackets the metro just above it is New York. Among LA households headed by someone 55 to 64, 59.9% own their home, while in the median big metro households two decades younger reach 62.8%. Past 65, Los Angeles ranks 55th for householders 65 to 74 and 54th for those 75 and older.


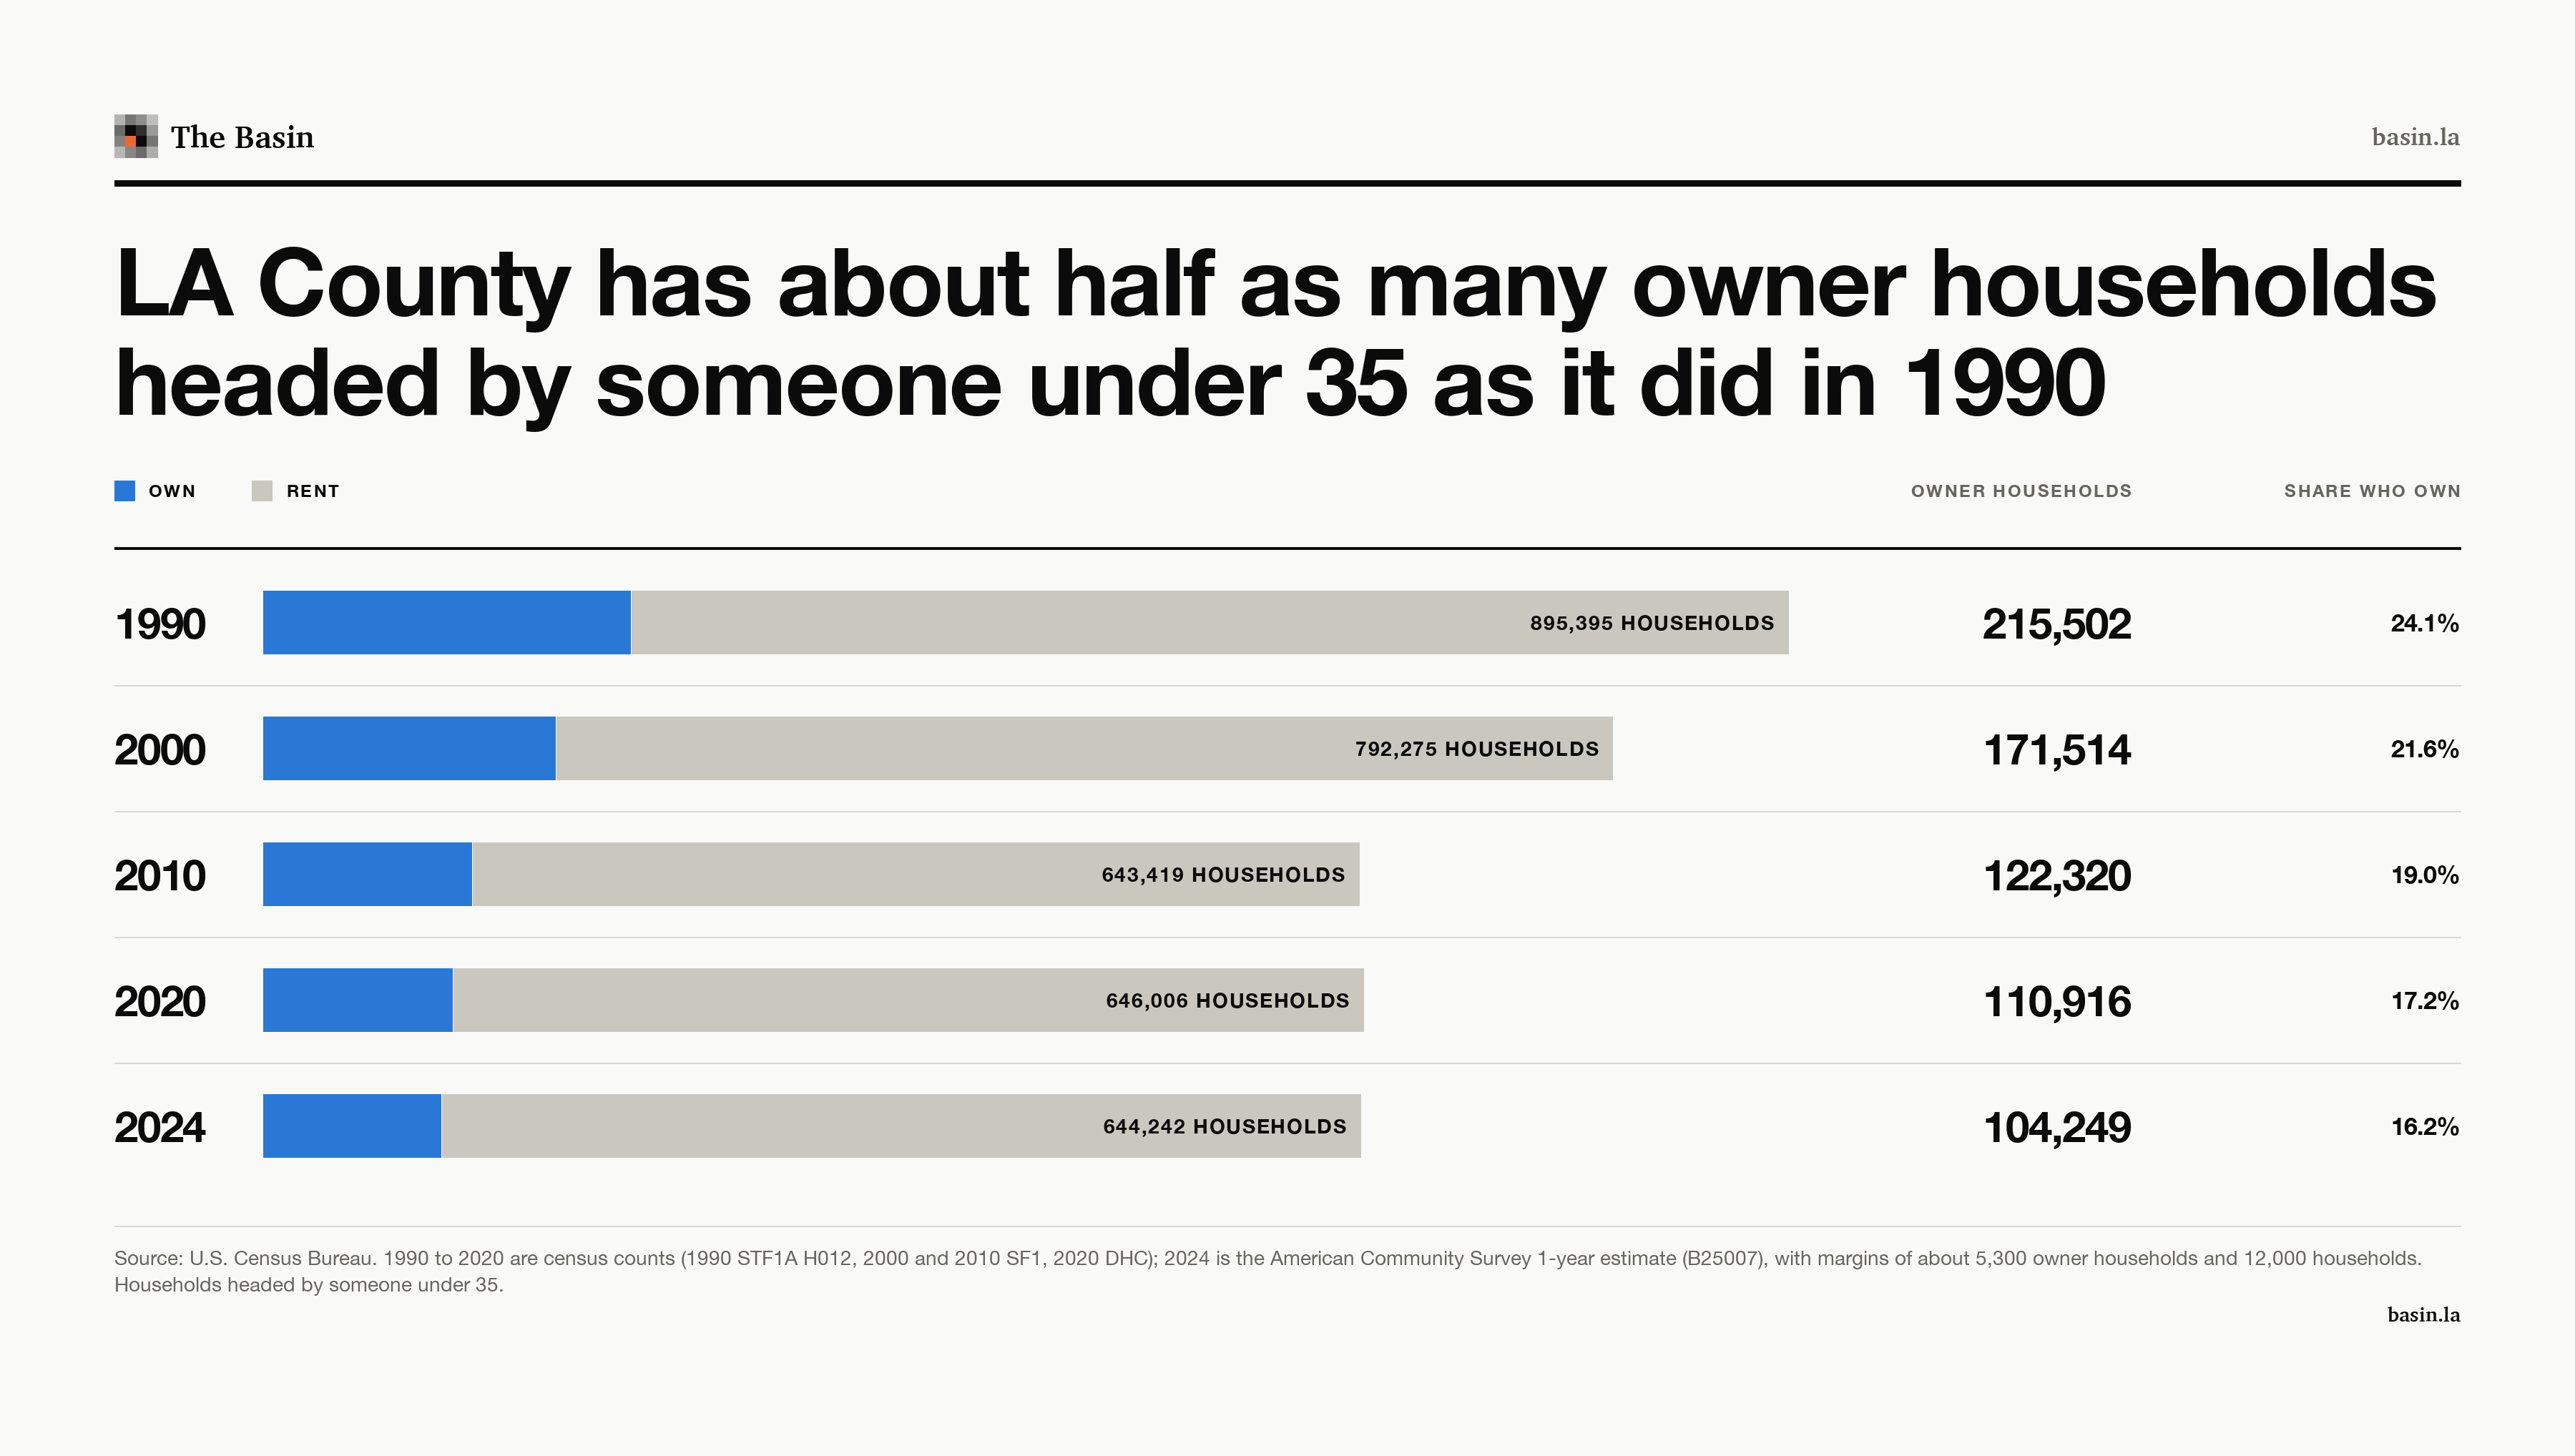
In Los Angeles County the share has fallen at every census since 1990, when 24.1% of households headed by someone under 35 owned their home. It was 21.6% in 2000, 19.0% in 2010 and 17.2% in 2020, and the 2024 survey puts it at 16.2%. Across California it went from 29.7% to 23.7% over the same years.
The county had 895,395 households headed by someone under 35 in 1990 and 644,242 in 2024, even as its total grew from 2.99 million households to 3.49 million, and almost all of that drop came before 2010. Over the same years the number of those young households that own fell from 215,502 to about 104,000, roughly half, and the number of owner households headed by someone 65 or older rose from 337,947 to about 573,000.


Owners in Los Angeles move less often than in almost any other big metro. Of the metro’s owner households, 18.9% moved into their home in 2020 or later and 32.4% have been there since before 2000. On both counts Los Angeles sits beside Pittsburgh and Buffalo, near the bottom of the 56 for recent arrivals and near the top for long-time owners.
Within the county, young households are least likely to own along the coast and through the dense middle, from Santa Monica to Glendale and Pasadena, and likelier toward the edges, including the north end of the San Fernando Valley and the eastern San Gabriel Valley. From 2020 through 2024, about 4 in 10 owned their home in Lancaster, Palmdale and Santa Clarita, and the same was true in Compton, Norwalk and Lakewood, south and southeast of downtown. In Carson it was about half, against 11.9% in the city of Los Angeles, 12.3% in Long Beach and 10% in Glendale and Santa Monica.


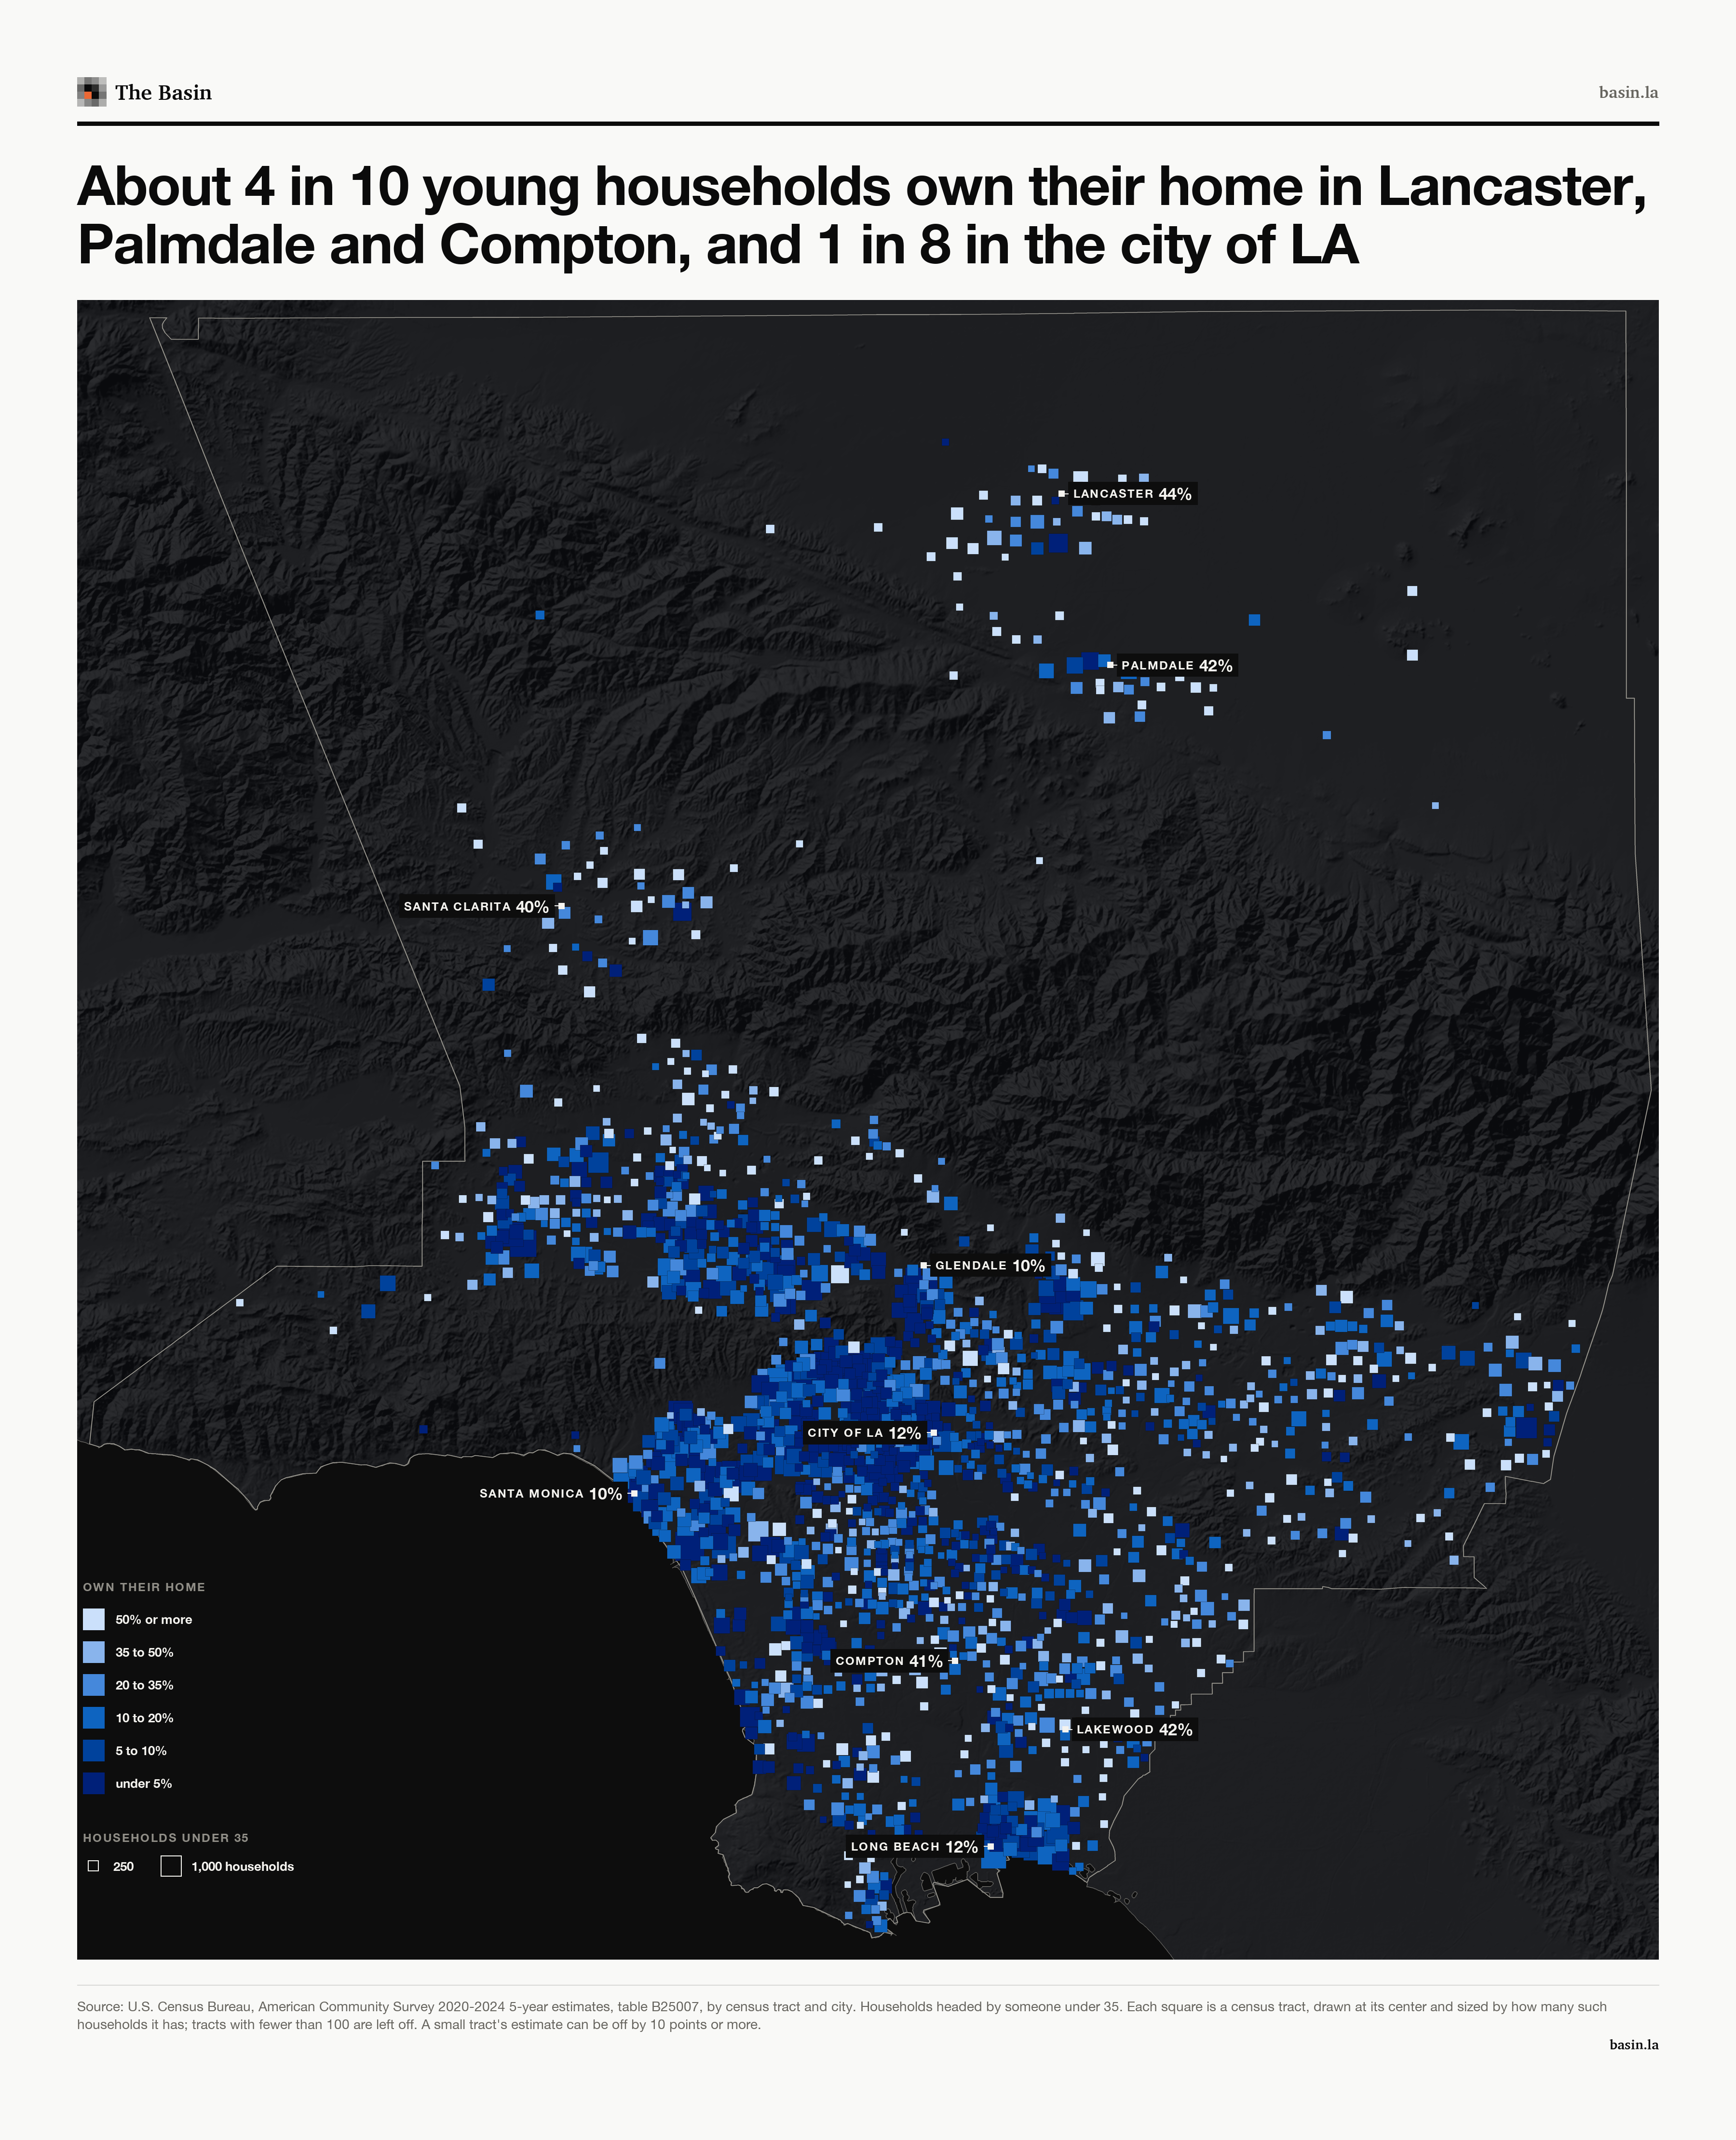
Method. Homeownership is the share of households whose home is owned by someone living in it, by the age of the householder, from table B25007 of the Census Bureau’s 2024 American Community Survey one-year estimates, for the 56 metropolitan areas with at least a million people, San Juan included. Los Angeles is called last only where its gap to the next metro passes the Census Bureau’s significance test at 90% confidence. That holds for the under-35 figure and for each 10-year bracket from 25 to 64, though at 55 to 64 New York is close behind, at 61.2% against 59.9%. The county and state figures for 1990 through 2020 are census counts of tenure by age of householder, from the 1990 STF1A, the 2000 and 2010 Summary File 1 and the 2020 Demographic and Housing Characteristics file, and each year matches the county’s published count of occupied homes. The 2024 figures are survey estimates, with margins of about 5,300 young owner households and 12,000 young households. Years in the home come from table B25038, and living arrangements from B09021, which leaves out dorms, barracks and other group housing. City and tract figures are 2020 to 2024 five-year estimates, and a small tract’s can be off by 10 points or more.