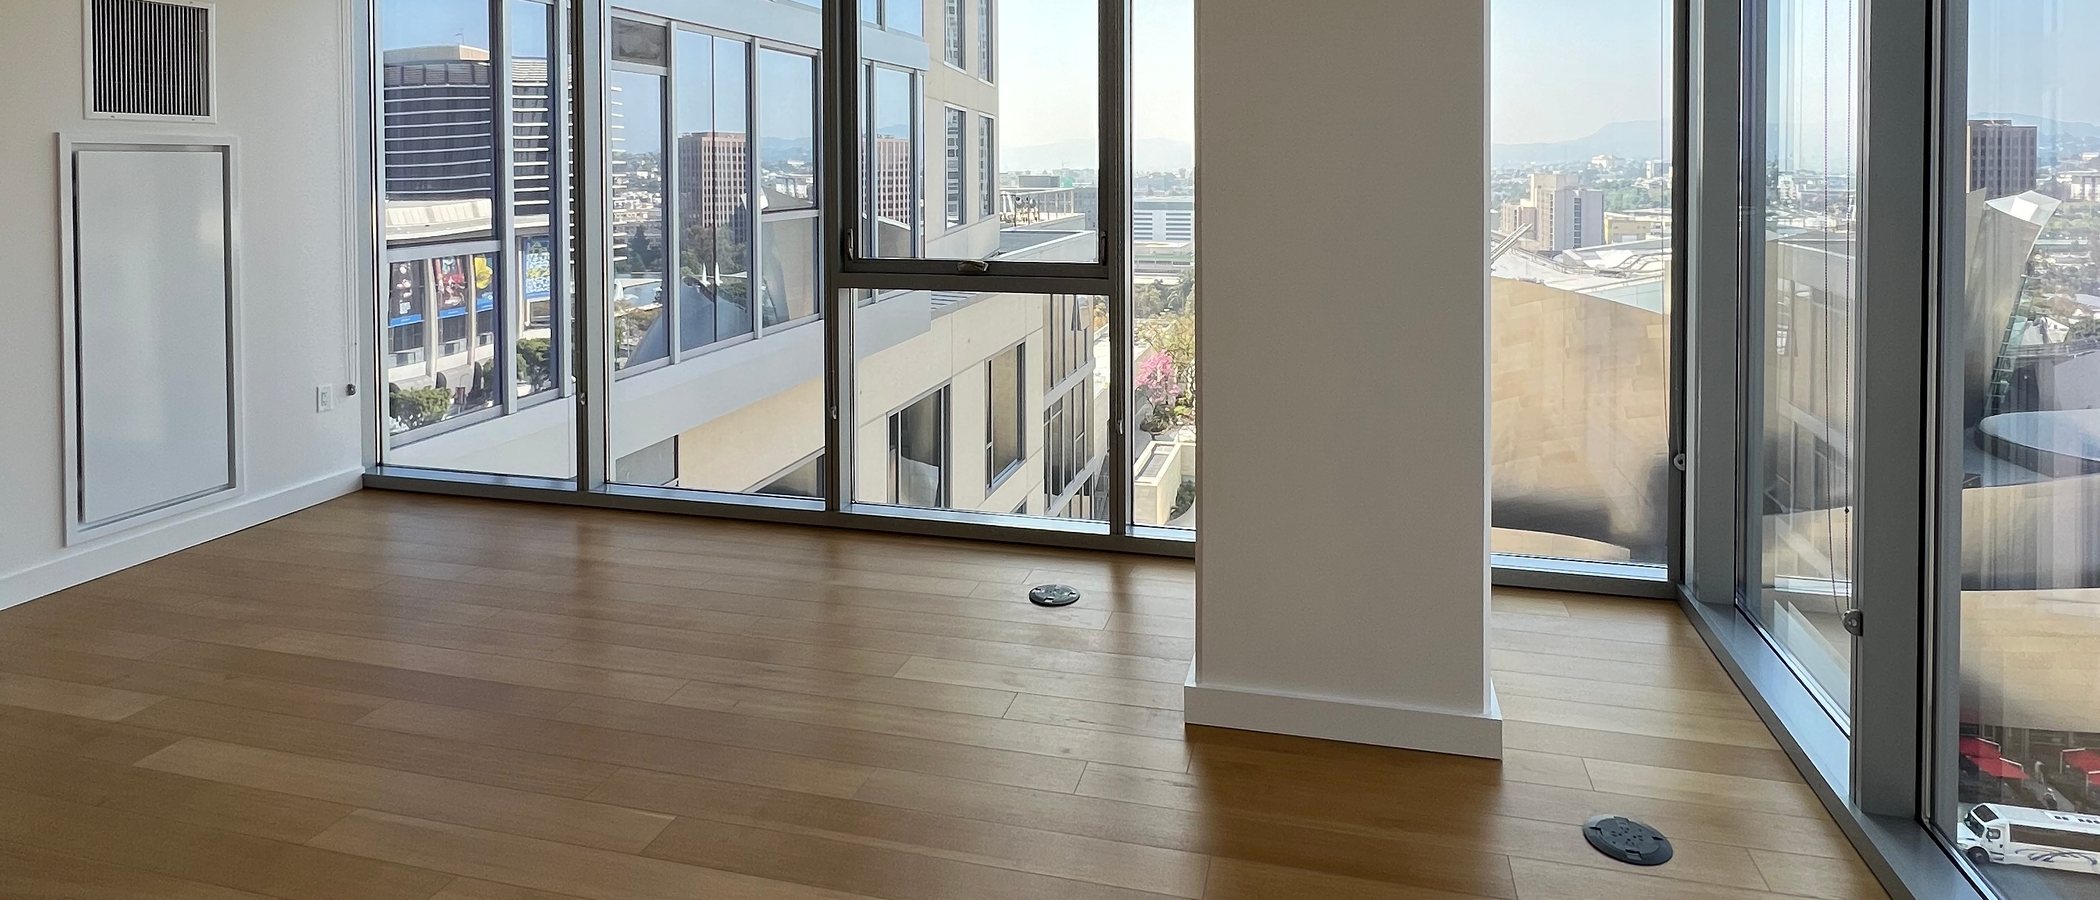
Los Angeles has more vacant homes than homeless people: 2.64 per person in the city and 3.27 countywide, comparing 2020–2024 estimates with average homeless counts. That part is absolutely true, but the arguments that use that stat to stifle conversations about the city's need for additional housing… Not so much.
The main issue is that the homeless count doesn't capture everyone who needs housing: people sharing overcrowded apartments, young adults trying to move out, or tenants searching for somewhere they can afford. Comparing vacancies with homelessness leaves those needs out.
Compared to other cities
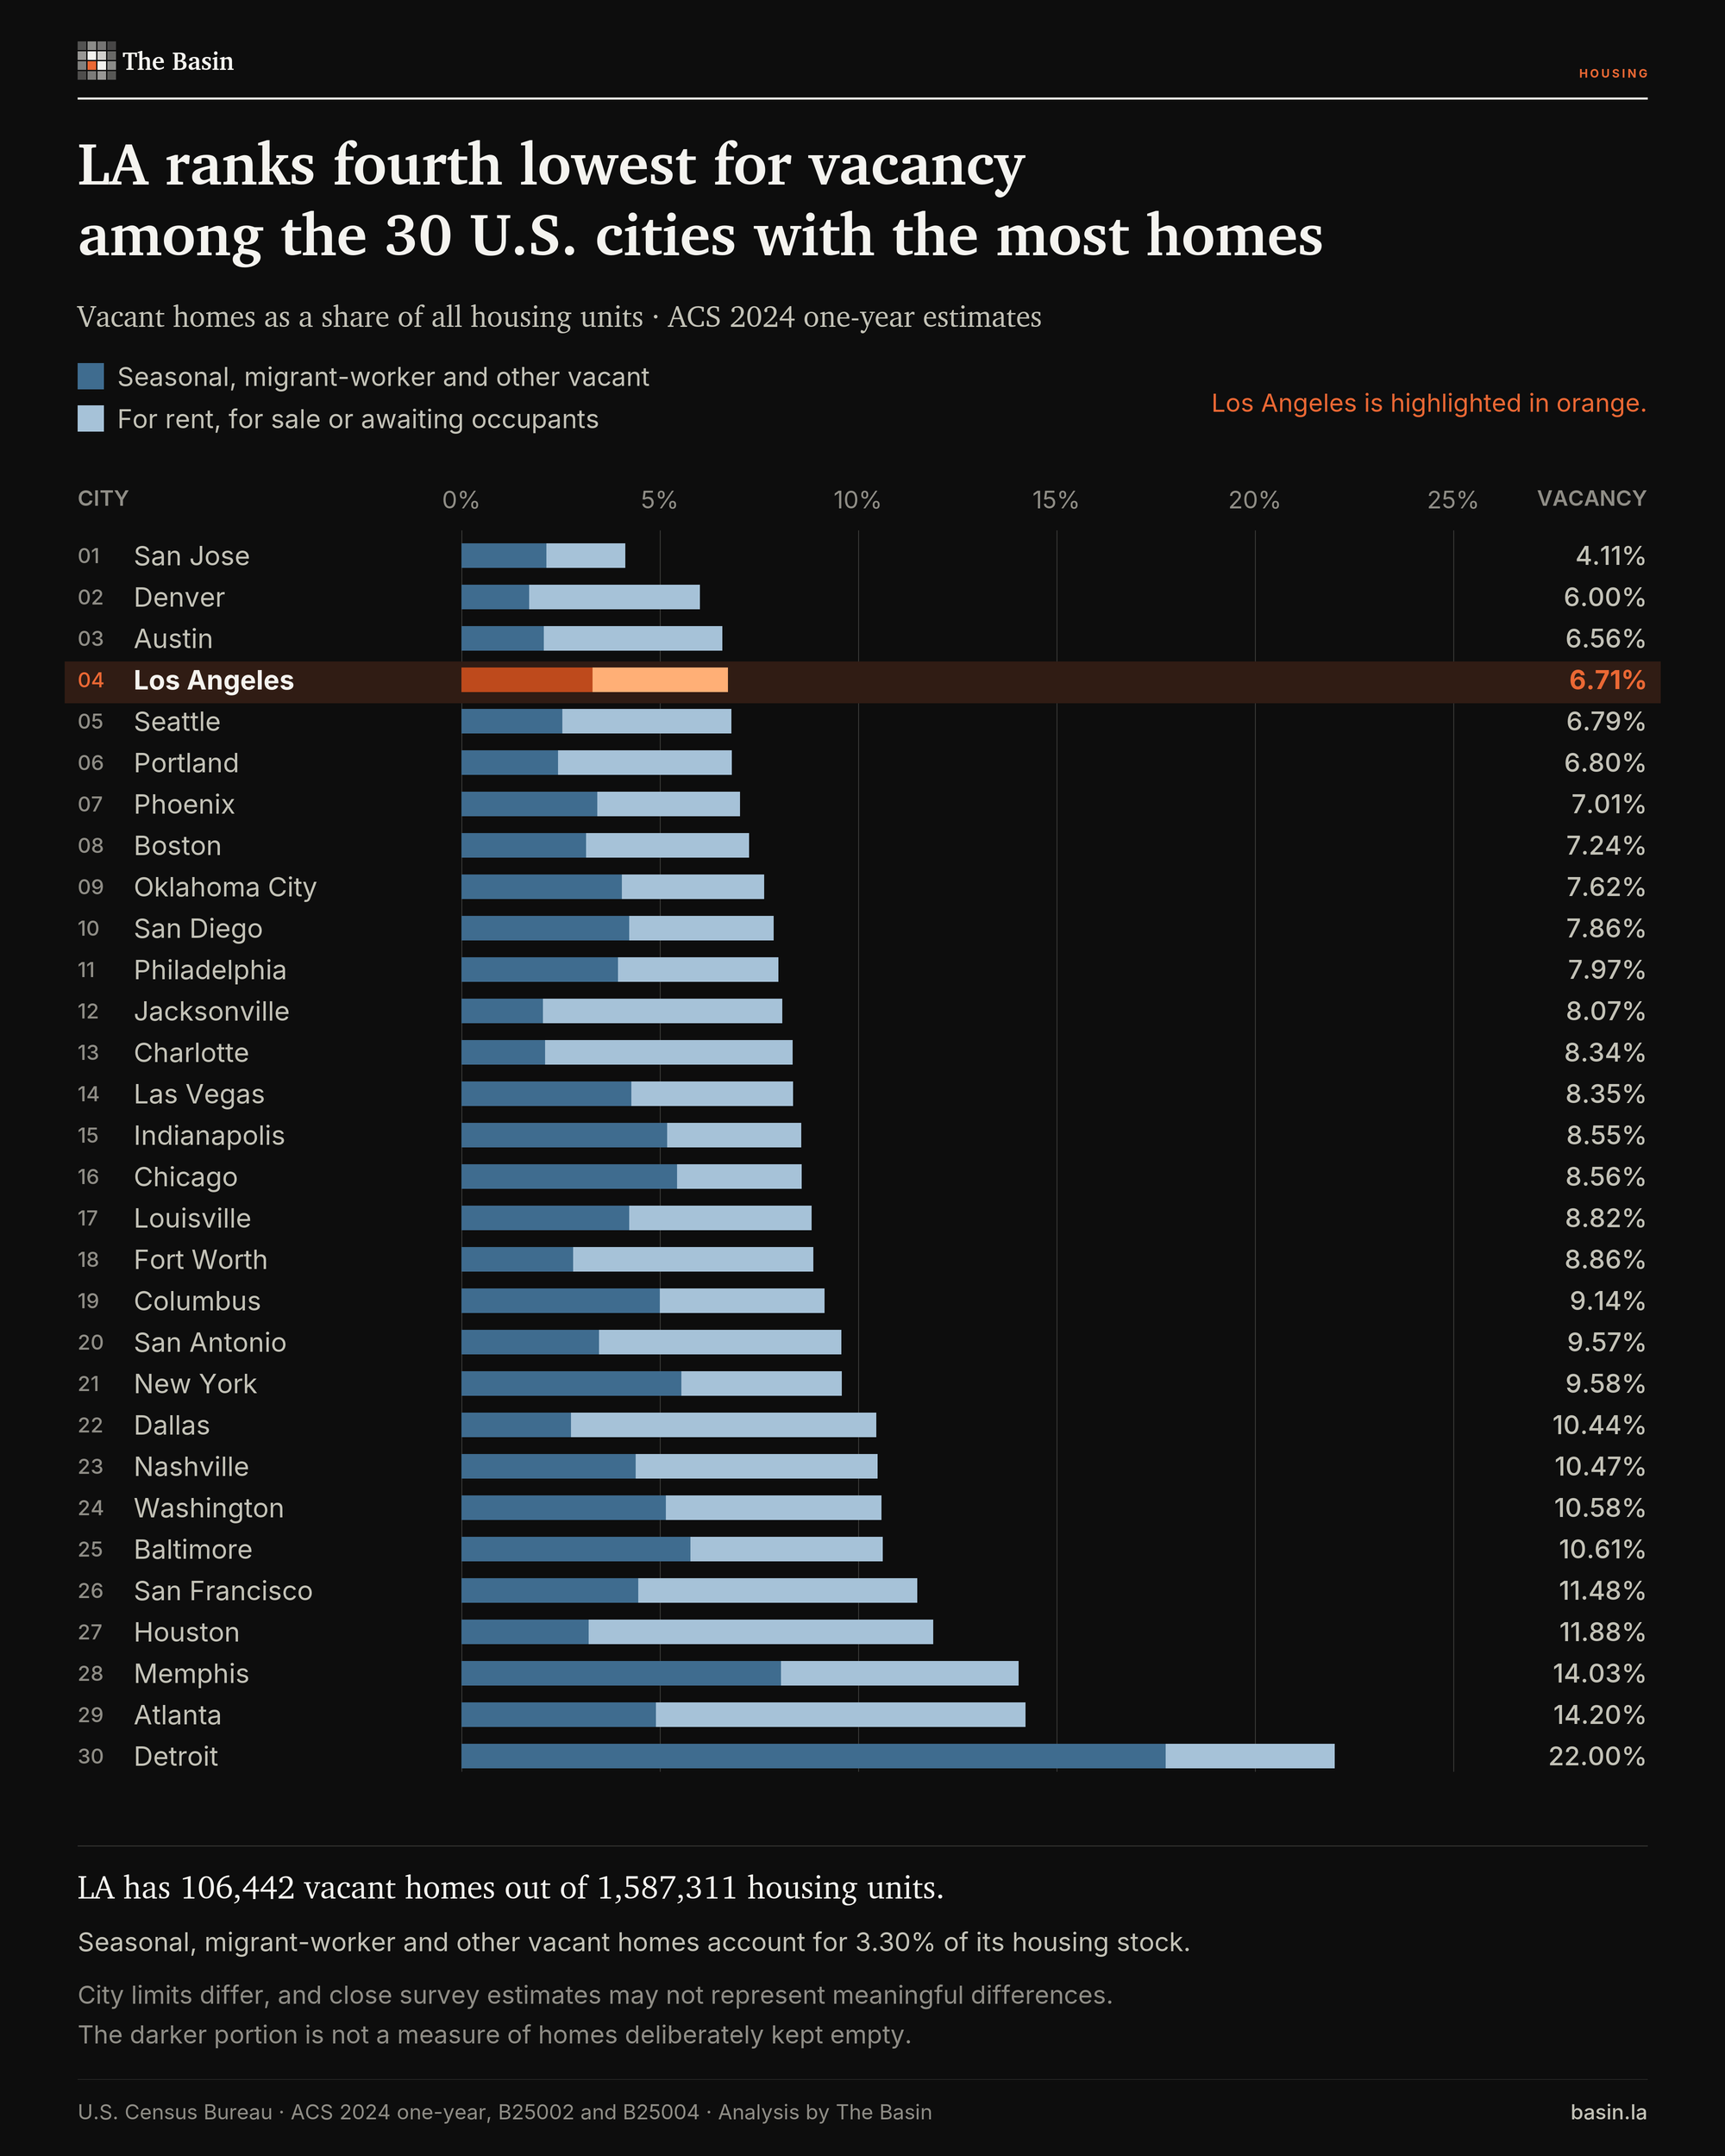
Among the 30 U.S. cities with the most homes, LA's 2024 vacancy rate of 6.71 percent is above only San Jose, Denver and Austin. On “other vacant” housing, LA ranks 12th lowest at 2.50 percent.
The rental market
For someone whose rent has become unaffordable, an available apartment means another option. LA's rental vacancy rate was 4.58 percent in the 2020–2024 survey, with a margin of error of ±0.18 percentage points. Having homes available between occupants is part of how people find somewhere to live.
Boyle Heights had an estimated rate of 1.80 percent, with a margin of ±0.66 percentage points; Panorama City was at 1.93 percent, with a margin of ±0.79 points.
Returning unused homes to occupancy can help. These figures don't establish what a vacancy tax could achieve, or make every vacancy a substitute for additional housing, including affordable homes, but stay tuned for that analysis!
Homes between occupants
Just over half of LA's vacancies are homes for rent, for sale or awaiting occupants. An advertised apartment or a sold house awaiting move-in isn't necessarily withheld housing.
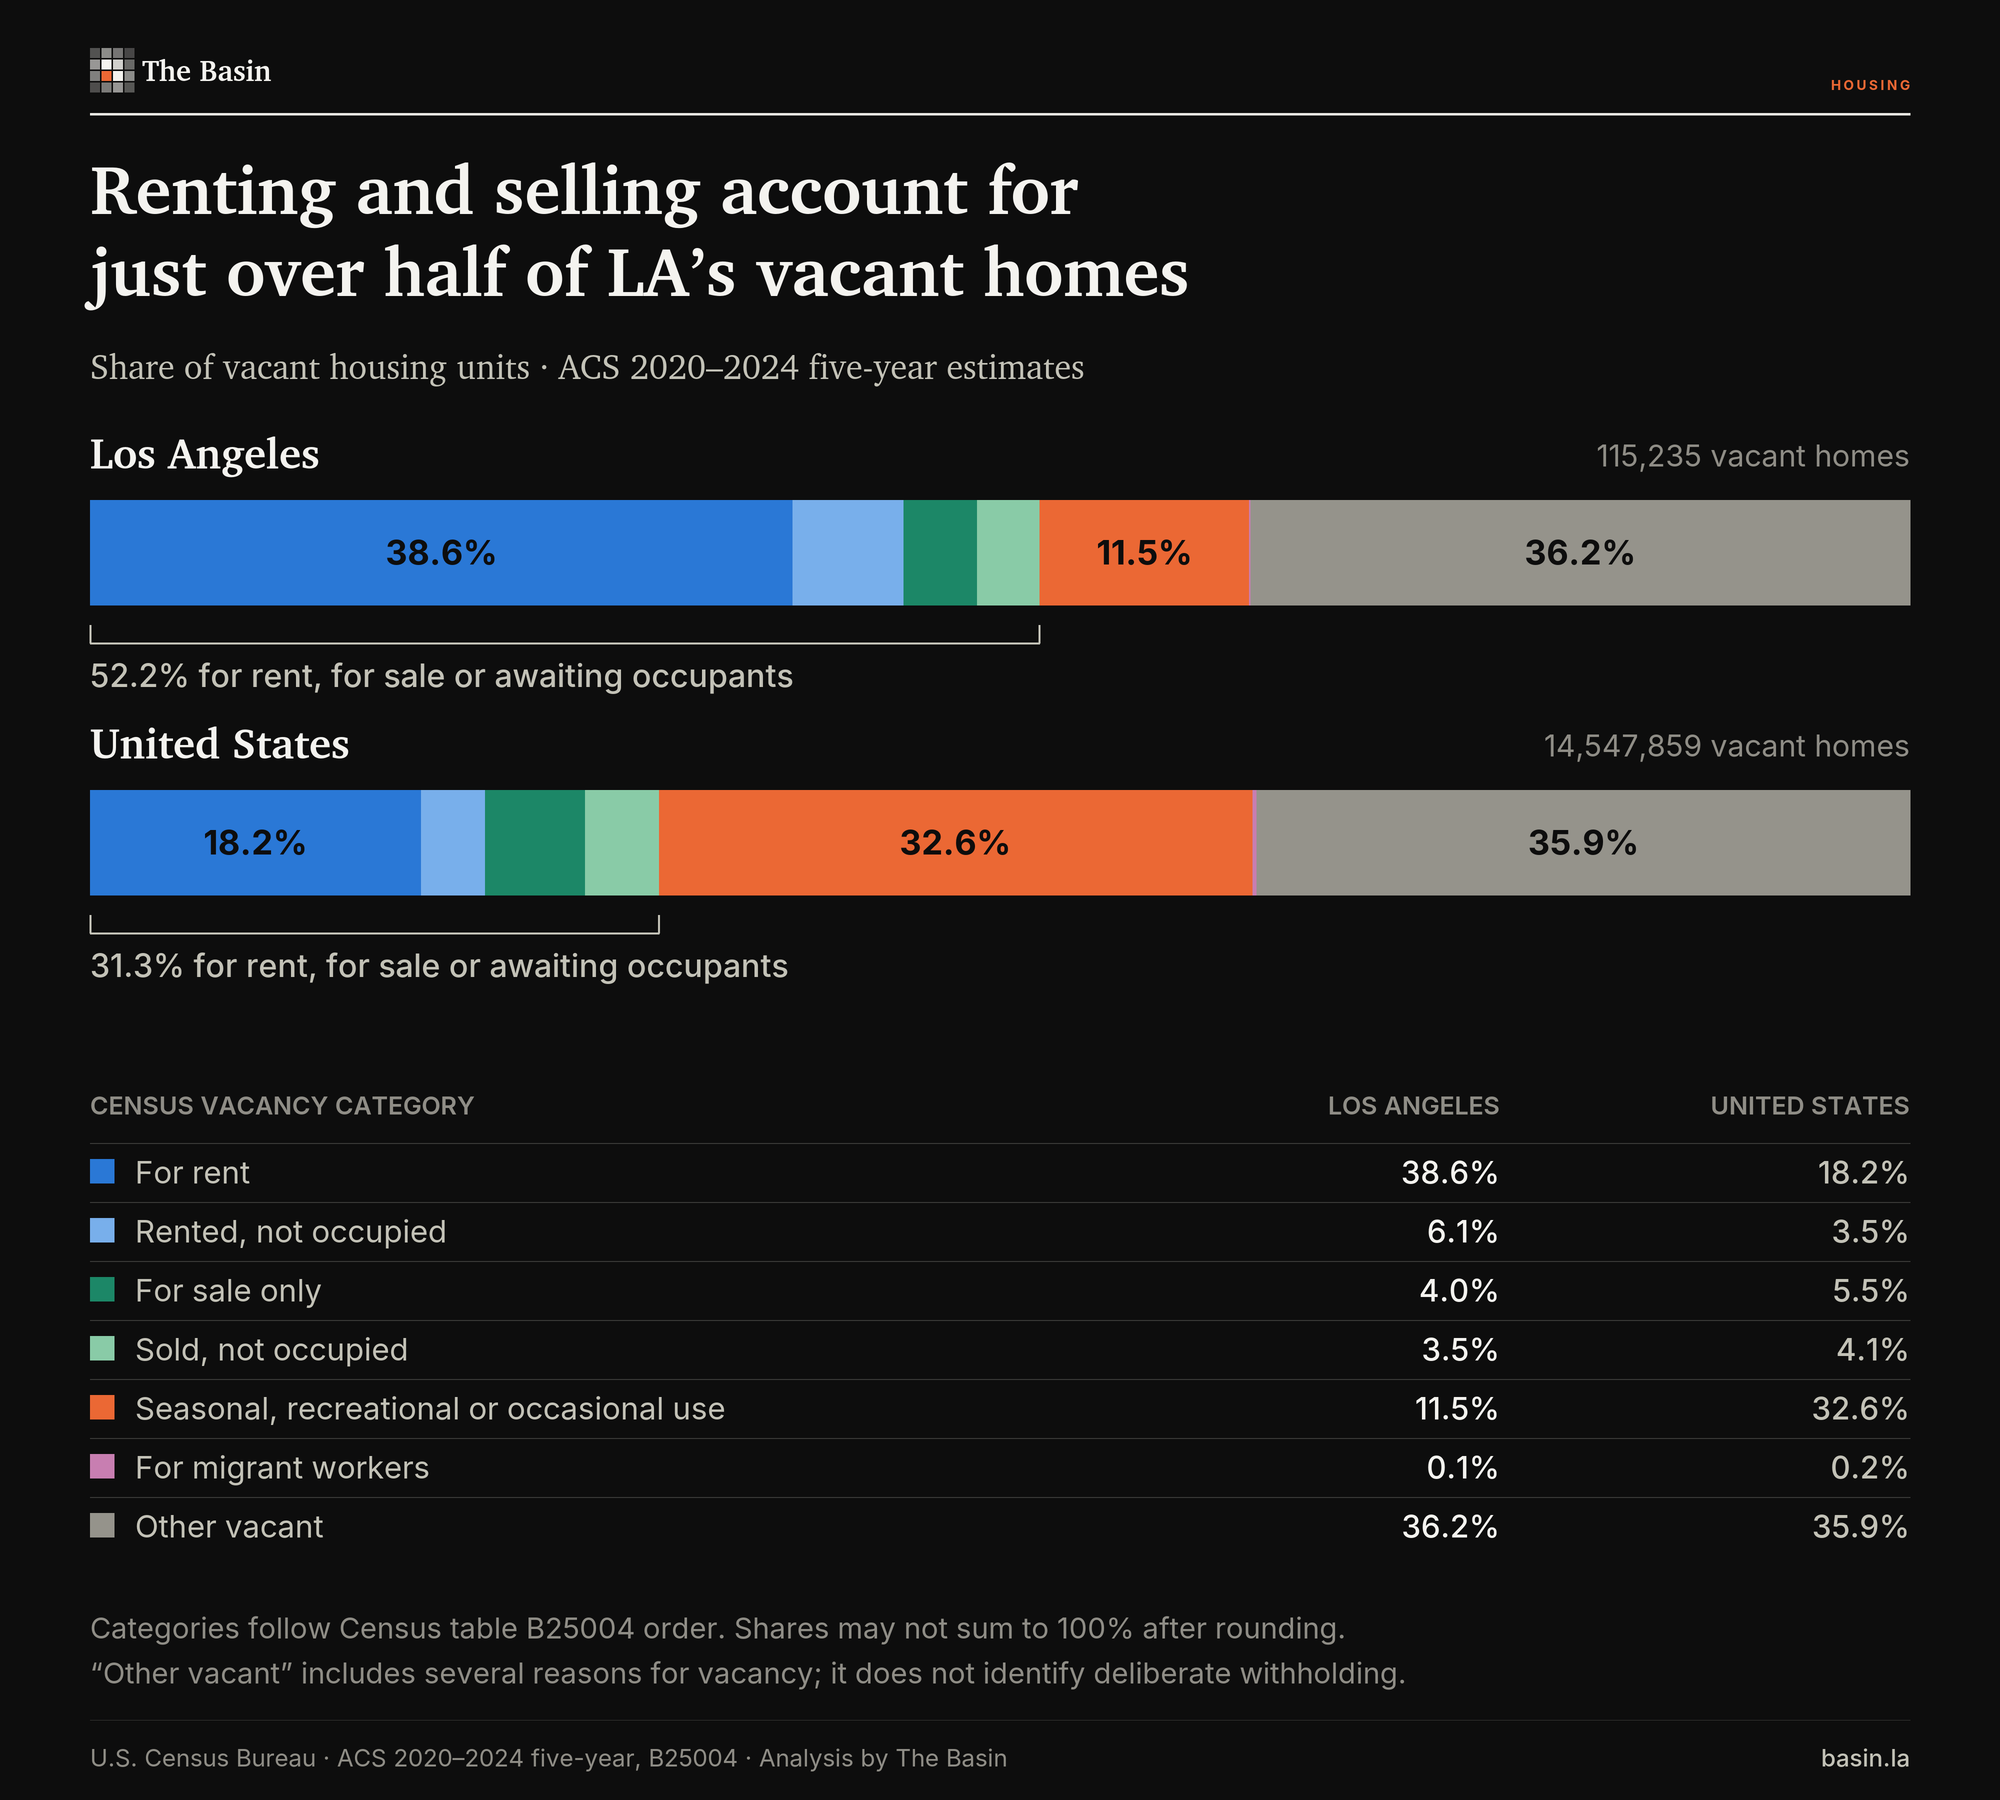
Seasonal, recreational and occasional-use homes account for another 11.5 percent of city vacancies, compared with 32.6 percent nationally.
The trendline
LA's annual vacancy estimate fell from about 8.5 percent in 2021 to 6.71 percent in 2024. Despite sampling uncertainty, the series offers no evidence of an accumulating stock of empty homes.
The April 2020 Census counted 5.76 percent vacancy; California's administrative series averaged 6.01 percent over 2020–2024, compared with 7.41 percent in the ACS's five-year estimate. Applied to the five-year housing stock, that gap represents roughly 22,000 to 26,000 homes.
Different residence rules and reference periods complicate comparisons; California also carries the Census forward. The unresolved gap doesn't establish that the ACS is wrong or measure deliberately withheld homes.
The remaining vacancies
Neighborhood income has little relationship with “other vacant” rates, though seasonal vacancy shows a clearer association.
LA's five-year estimate includes 41,751 “other vacant” homes, with a margin of ±1,798. That's roughly comparable to the city's homeless count once uncertainty is considered; countywide, this category outnumbers homeless people 1.25 to one.
It includes homes under repair, in probate or foreclosure, awaiting demolition or kept for relatives. The available data don't show how many could be occupied soon, what that would require, or how many are deliberately kept empty.
Returning usable homes to occupancy is worth pursuing. So is building more housing, including homes affordable to people the market does not adequately serve. LA should pursue both. The goal is to give people enough affordable choices that finding somewhere to live, or somewhere else to move, is a real option.
Sources and method. City rankings use ACS 2024 one-year estimates; vacancy composition, rental rates and neighborhood comparisons use ACS 2020–2024 five-year estimates. Homeless comparisons use the mean of LAHSA's 2020, 2022, 2023 and 2024 counts within the same geography; no count took place in 2021. Margins shown are at 90 percent confidence. Source tables, definitions and calculations are held in The Basin's vacancy dataset.