Neighborhoods Council districts Your Government Licensing & data About
The Basin
Data journalism from the Los Angeles Basin
Neighborhoods

Playa del Rey

11,820 residentsmostly in Council District 11

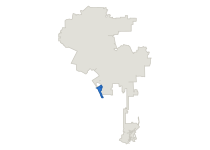
Where Playa del Rey sits in the city of Los Angeles
18.80
Park acres per 1,000
Citywide 4.216th of 109
0
Metro rail stations
Citywide 5731st of 114
23.7
Restaurants per 10,000
Citywide 30.155th of 109
0.00
Affordable per 1,000
Citywide 8.7677th of 109
34.4
Offenses per 1,000
Citywide 36.546th of 109

45.8% of renter households in Playa del Rey pay 30% or more of their income on rent, against 59.2% citywide, 105th of 108. It has 18.80 acres of city park land per 1,000 residents, against 4.21 citywide, 6th of 109.

All 114 neighborhoods By council district instead

Residents

These figures cover everyone who lives here, owners and renters alike.

Measure
This neighborhood
Citywide
Rankmost to least
Homes that are rented
Share of occupied homes with a renter in them.
54.4%
64.0%
69th of 109
The census inputs behind this figure are apportioned from tracts by area, so a tract split by a neighborhood boundary counts in proportion to its area. Parks, parcels and restaurants are mapped at their own coordinates instead.
Median household income
Median of the tract medians, weighted by households.
$146,633
$90,763
13th of 109
Estimated from household-weighted census-tract medians; the Census Bureau does not publish a median for this neighborhood.
Residents per square mile
Population over land area, excluding water.
4,535
8,221
94th of 109
Residents with a bachelor's degree or more
Share of residents aged 25 and over.
72.2%
38.4%
12th of 109

Boundaries are the Mapping L.A. neighborhood set. Population and every demographic figure is the U.S. Census Bureau's American Community Survey 2020-2024 five-year tract estimate, apportioned to neighborhood lines by area from the same 2,495 county tracts every other Basin geography is built from.

Rent

Every figure in this section covers renter households only.

Measure
This neighborhood
Citywide
Rankmost to least
Renters paying 30% or more of income on rent
Share of renter households whose rent takes 30% or more of income.
45.8%
59.2%
105th of 108
The census computed this share inside each household, where the rent and the income belong to the same family, and this page pools the resulting counts. Households whose share couldn't be computed are left out of the denominator.
Renters paying half their income or more
Share of renter households whose rent takes 50% or more of income.
22.7%
32.6%
103rd of 108
The census calls this severe rent burden, and these households are already counted in the line above.
Median gross rent
Rent plus utilities, monthly, for renters paying cash rent.
$2,873
$1,932
9th of 108
Gross rent includes utilities the tenant pays, so it runs above the rent on a lease. It leaves out renters who pay no cash rent, 2.2% of the city's renters.
Median renter household income
Renter households only, unlike the median household income under Residents.
$124,386
$63,686
5th of 108
This counts renter households only, so it can't be compared with the median household income under Residents, which includes owners and is built a different way.
Rent as a share of renter income
A year of the median rent over the median renter household's income.
27.7%
36.4%
106th of 108
This divides the median gross rent by the median renter household income, both interpolated from pooled census bins, so it only approximates the burden figure above. Using the income of all households instead would lower the citywide figure by eight points.

U.S. Census Bureau American Community Survey 2020-2024 five-year estimates, tables B25063 gross rent, B25118 household income by tenure and B25070 rent as a share of income, apportioned to neighborhood lines by area. Rents and incomes are interpolated from the pooled census bins, because tract medians can't be averaged together.

Parks and open space

A neighborhood can rank high for park acreage and low for the share of residents near a park, or the other way around.

Measure
This neighborhood
Citywide
Rankmost to least
City park land per 1,000 residents
222.2 acres here. Recreation and Parks land only, with overlapping parks counted once.
18.80
4.21
6th of 109
Population is apportioned from tracts by area.
City park sites
Distinct Recreation and Parks sites touching the neighborhood.
5
536
35th of 114
A park that crosses a boundary is counted in both neighborhoods, so these don't add up to the citywide total.
Residents within half a mile of an open park
Straight-line half mile to any open-access park, any agency.
63.7%
75.9%
82nd of 109
Distance is measured in a straight line rather than along streets, so this overstates how many people can actually walk there.

City of Los Angeles Department of Recreation and Parks park boundaries, GeoHub layer LA_City_Parks_Boundaries, last modified 2025-08-18, retrieved 2026-08-13. Parks that overlap are counted once in the acreage.

Transit

Stations and stops are Metro's, and walking distance is measured in a straight line.

Measure
This neighborhood
Citywide
Rankmost to least
Metro rail stations
Stations inside the neighborhood, all Metro rail lines.
0
57
31st of 114
Bus stops per 10,000 residents
14 stops here. Metro bus stops with weekday service.
11.8
18.0
85th of 109
A stop served twice an hour and a stop served twice a day count the same here.
Residents within a quarter mile of a bus stop
Straight-line quarter mile to a Metro bus stop with weekday service.
58.0%
77.5%
78th of 109

LA Metro GTFS rail and bus schedule feeds, retrieved 2026-08-13 for the service window beginning that day.

Homes

The three counts below measure different things and shouldn't be added together.

Measure
This neighborhood
Citywide
Rankmost to least
Income-restricted homes per 1,000 residents
0 homes here. Covenanted affordable units in the Housing Department inventory.
0.00
8.76
77th of 109
Covenanted and federally assisted units are different programs that overlap by an unpublished amount, so the two counts can't be added together.
Net homes permitted since 2020
Units added minus units removed on issued building permits.
2
75,381
109th of 114
These count issued permits, and a permitted home may not be built yet.
Federally assisted properties
Distinct properties on an active or expired federal contract.
0
363
79th of 114
Each property is counted once, since 415 contracts cover 363 buildings citywide.

Los Angeles Housing Department affordable-housing inventory, the federal Multifamily Assistance and Section 8 contract database, and Los Angeles Department of Building and Safety issued permits for 2020-01-01 to 2026-08-10. Each site is mapped at its own coordinates.

Rent-stabilized housing isn't on this page. The Housing Department publishes it only by ZIP code and by council district, and ZIP codes don't line up with neighborhoods, so a neighborhood figure would have to be estimated. Most of this neighborhood sits in Council District 11, which carries it.

Restaurants

Restaurants are counted at their own addresses in the county health inventory.

Measure
This neighborhood
Citywide
Rankmost to least
Restaurants per 10,000 residents
28 restaurants here. Permitted restaurants in the county health inventory.
23.7
30.1
55th of 109
Restaurants are counted where they stand, so a neighborhood people travel to for dinner rates higher than one they travel from.
Restaurants that are not chains
27 of 28 here. Share of the neighborhood's restaurants outside a recognized chain.
96.4%
86.6%
2nd of 94
This is shown only for neighborhoods with at least twenty restaurants, because below that a single opening moves the share by several points.

Los Angeles County Department of Public Health Environmental Health restaurant and market inventory, snapshot 2026-07-01, retrieved 2026-08-13. Each restaurant is mapped at its own coordinates rather than by the city name on its record.

Reported crime

These are the nine serious offense categories for 2023, the last full year before the LAPD changed how it counts crime.

Measure
This neighborhood
Citywide
Rankmost to least
Reported serious offenses per 1,000 residents, 2023
336 offenses here. Nine Part I offense categories, apportioned by area share.
34.4
36.5
46th of 109
Crime is recorded where it happens, so a neighborhood holding downtown, a stadium, an airport or a transit hub carries offenses against people who don't live there, while the rate divides by residents only. The effect is larger for neighborhoods than for council districts, where such sites sit among roughly a quarter of a million residents.
Reported violent offenses per 1,000 residents, 2023
42 offenses here. Homicide, rape, robbery and aggravated assault.
4.2
8.0
67th of 109
Two in five police reporting districts cross a neighborhood line, compared with fewer than one in five for council districts, so these counts are split by area share rather than tallied from reports.

Los Angeles Police Department incident records, reclassified onto one consistent Part I offense hierarchy by The Basin and apportioned from reporting districts to neighborhoods by area share.

Property and the tax base

The property tax is billed to owners, who aren't named on the roll and may not live in the neighborhood.

Measure
This neighborhood
Citywide
Rankmost to least
Net taxable property value
2025 assessment roll, every parcel placed by its own coordinates.
$4,008,674,147
$834,825,925,731
64th of 114
The tax is billed to the owner of record. The roll doesn't name owners, and they may not live in the neighborhood, so these totals don't measure what residents paid.
Net taxable value per parcel
4,284 parcels here. This is assessed value, which Proposition 13 holds near the last sale price, so it usually sits below market value.
$935,732
$1,039,271
51st of 112
Two identical houses can be assessed decades apart, so this tracks when property last changed hands as much as what it's worth.

Los Angeles County Assessor annual assessment roll for 2025, with each parcel mapped at its own coordinates.

Bordering neighborhoods

They're listed from the longest shared border with Playa del Rey to the shortest.

Westchester, Playa Vista, Venice.

Method

Every figure on this page comes from a public record. Where a figure is a rate, the citywide number beside it divides the city's total by the city's population rather than averaging the 114 neighborhood rates, which would give a different answer. A rank of 1 is the highest value among the 114 neighborhoods.

The boundaries are the Mapping L.A. neighborhood set, 114 areas covering 99.9% of the city's residents. They're separate from council districts and neighborhood councils, and they have no government of their own. Every figure is built from the same 2,495 census tracts as the council-district pages, so the two sets of pages reconcile with each other.

Rates are withheld for the five areas with fewer than 4,000 residents, which are a dam, a reservoir, two parks and a flood basin. Counts are shown for all 114.

Reported crime is split across these boundaries by area. Two in five police reporting districts cross a neighborhood line, compared with fewer than one in five for council districts, so the crime figures here are estimates rather than counts of reports. The population behind the crime rates is one census estimate used for every year, so the rates compare neighborhoods with each other but not one year with another.

The data behind this page is published at Basin Data. Send corrections to data@basin.la.