A note. We first published this on 22 August counting restaurants from OpenStreetMap, which turned out to hold fewer than half of them. This version is rebuilt on the county’s permit register. What changed, and by how much, is set out at the end.
Every place in Los Angeles County that sells food to the public needs a public health permit before it can legally open, and county inspectors enforce it. The county’s Environmental Health division publishes the register of who holds one, and inside the 114 Mapping L.A. neighborhoods that make up the City of Los Angeles, it lists 11,573 restaurants.
No other public source comes close to its coverage of food businesses operating legally. Liquor licenses only cover places that serve alcohol and the assessor doesn’t record what a building is used for, while OpenStreetMap, the volunteer map the first version of this story relied on, holds whatever its volunteers have gotten around to adding. The register has limits of its own, and they’re set out at the end.
The top of the list
Twenty of the 114 neighborhoods hold half the city’s restaurants between them, and another 24 have at least 100 each.
| # | Neighborhood | Restaurants | Per sq mi | Per 10,000 residents |
|---|---|---|---|---|
| 1 | Downtown | 928 | 159.9 | 133.9 |
| 2 | Koreatown | 591 | 218.6 | 57.6 |
| 3 | Hollywood | 507 | 144.9 | 68.8 |
| 4 | Northridge | 294 | 31.2 | 44.3 |
| 5 | Sherman Oaks | 272 | 29.9 | 38.1 |
| 6 | Westchester | 257 | 23.6 | 61.8 |
| 7 | Van Nuys | 255 | 28.4 | 23.3 |
| 8 | North Hollywood | 253 | 43.0 | 32.4 |
| 9 | Boyle Heights | 243 | 37.8 | 28.4 |
| 10 | Sawtelle | 234 | 87.2 | 55.6 |
Every neighborhood in Los Angeles, by number of restaurants
All 114 Mapping L.A. neighborhoods, ranked
Downtown has 57 percent more restaurants than Koreatown, but it also has more than twice the land, 5.8 square miles to Koreatown’s 2.7. Koreatown packs 218.6 restaurants into each square mile against Downtown’s 159.9, the highest density in the city, and Fairfax is third at 154.6 on just 1.2 square miles.
Count against land area
Each gray ray is a fixed density. A neighborhood on a steeper ray packs more restaurants into each square mile, whatever its total. 113 of the 114 are here; Pacific Palisades sits off the right edge at 22.8 square miles and 31 restaurants.
Source: LA County Department of Public Health food facility register. Land area from the Mapping L.A. boundaries. Hover a named point for its figures; the rest are plotted but not named.Per resident, Fairfax leads the city, though barely. It has 191 restaurants for 14,124 people, or 135.2 for every 10,000, against 133.9 Downtown and 125.3 in Century City, two places where the daytime population dwarfs the residential one.
The other end of the list
Eleven neighborhoods have fewer than ten restaurants, and two of them have none.
| Neighborhood | Restaurants | Population |
|---|---|---|
| Chatsworth Reservoir | 0 | 216 |
| Mount Washington | 0 | 13,278 |
| Hansen Dam | 1 | 60 |
| Sepulveda Basin | 2 | 841 |
| Elysian Park | 4 | 2,426 |
| Beverly Crest | 7 | 9,826 |
| Lake View Terrace | 7 | 12,371 |
| Elysian Valley | 8 | 7,105 |
| Rancho Park | 8 | 5,610 |
| Bel-Air | 9 | 7,572 |
| Beverlywood | 9 | 7,055 |
A reservoir, a dam, a flood basin and a park account for four of the eleven. The other seven are residential neighborhoods, four of them among the wealthiest in the city and none of them poor. Restaurants thin out where commercial streets do, which happens in open space and in neighborhoods that are mostly housing.
Divided by population, the bottom of the list takes in poor neighborhoods in South Los Angeles as well as residential ones in the hills and the northeast Valley. Mount Washington is still last, with no restaurants for 13,278 people, and Watts is next, with 20 for 37,061, or 5.4 for every 10,000, about a twenty-fifth of Fairfax’s rate. Lake View Terrace, Montecito Heights and Broadway-Manchester, which has 17 for 28,843, all come in under 6. Arleta has 21 for 31,489 and Vermont Vista 18 for 25,843, both just under 7.
Restaurants and income
The 107 neighborhoods with a census income figure split into quarters of 26 to 29 neighborhoods each, from poorest to richest.
| Income quartile | Household income | Restaurants | Per 10,000 residents |
|---|---|---|---|
| Poorest 25% | $56,546 | 2,662 | 24.6 |
| Second | $77,327 | 3,593 | 32.7 |
| Third | $100,102 | 2,545 | 29.5 |
| Richest 25% | $145,764 | 2,737 | 34.7 |
The richest quarter has 1.4 times as many restaurants per resident as the poorest, but the two middle quarters are out of order, and between them the rate hardly moves. Over all 107 neighborhoods, the correlation between income and restaurants per resident is +0.10, which is close to none.
National chains
Every record in the register carries a business name, so we matched the names against a list of national fast-food, coffee and dessert brands. That turns up 1,548 chain restaurants, 13.4 percent of the 11,573, counting a brand as national if it also operates outside California.
| Neighborhood | Chain share |
|---|---|
| Mission Hills | 39.1% (18 of 46) |
| Baldwin Hills/Crenshaw | 32.6% (15 of 46) |
| Hyde Park | 27.5% (11 of 40) |
| University Park | 26.5% (30 of 113) |
| ... | |
| Central-Alameda | 4.5% (3 of 66) |
| Silver Lake | 4.4% (6 of 136) |
| Venice | 4.0% (8 of 202) |
| Chinatown | 3.1% (3 of 97) |
Chain share of each neighborhood’s restaurants
Every neighborhood with at least 40 restaurants, ranked by the share that are a national brand
Bars run from the citywide share of 13.4 percent.
Source: LA County Department of Public Health food facility register. 75 of the 114 neighborhoods clear the 40-restaurant floor. Brands are matched on the facility name against a list of national fast-food, coffee and dessert brands.Mission Hills, at the top of the table, is an upper-middle-income Valley neighborhood, and the next three, Baldwin Hills/Crenshaw, Hyde Park and University Park around USC, are all in the poorest quarter of the city. Central-Alameda, near the bottom, is in the poorest quarter too, with three chains among its 66 restaurants. Across the 75 neighborhoods in the chart, the correlation between chain share and income is a weak -0.15.
What changed from the first version
The 22 August version counted 5,465 places from OpenStreetMap. The register has 11,573, so that count was 47 percent of the city, and the missing half was not missing at random. Volunteer coverage of a neighborhood tracks its income: the map had 34 percent of the restaurants in the poorest quarter of Los Angeles and 59 percent of those in the richest.
Volunteer-map coverage by neighborhood income
One dot per neighborhood with at least ten restaurants
Up the axis is the share of that neighborhood’s permitted restaurants that OpenStreetMap had found. Across is population-weighted median household income. The orange steps show the same thing by income quartile.
Sources: LA County Department of Public Health food facility register and OpenStreetMap via Basin Data, la-places-master. Coverage above 100 percent means the volunteer map carried more entries than there are permits, which happens where closed places were never removed. Correlation is +0.34 across the city and +0.44 among the 75 neighborhoods with 40 or more.| Neighborhood | First version | Register | Map had |
|---|---|---|---|
| Central-Alameda | 4 | 66 | 6% |
| Wilmington | 12 | 109 | 11% |
| Historic South-Central | 13 | 112 | 12% |
| Westlake | 50 | 228 | 22% |
| Pacoima | 33 | 126 | 26% |
| Woodland Hills | 205 | 233 | 88% |
| Palms | 104 | 110 | 95% |
| Westwood | 173 | 160 | 108% |
Three claims are withdrawn. Central-Alameda does not have four restaurants for 42,026 people; it has 66, which is 15.7 per 10,000, about half the city’s rate. The contrast between Pacoima at seven counters in ten and Chinatown at one in ten compared a neighborhood the map had covered 26 percent of with one it had covered 71 percent of, and the register cannot rebuild it because it does not record table service. And our caveat that volunteer bias ran against the Valley had it backwards: Woodland Hills was among the best-mapped neighborhoods in the city, South Los Angeles the worst.
OpenStreetMap does not invent restaurants. 90 percent of its rows sit within 60 meters of a permitted facility and 97 percent within 150. Its omissions are what sort by income.
Method and limits
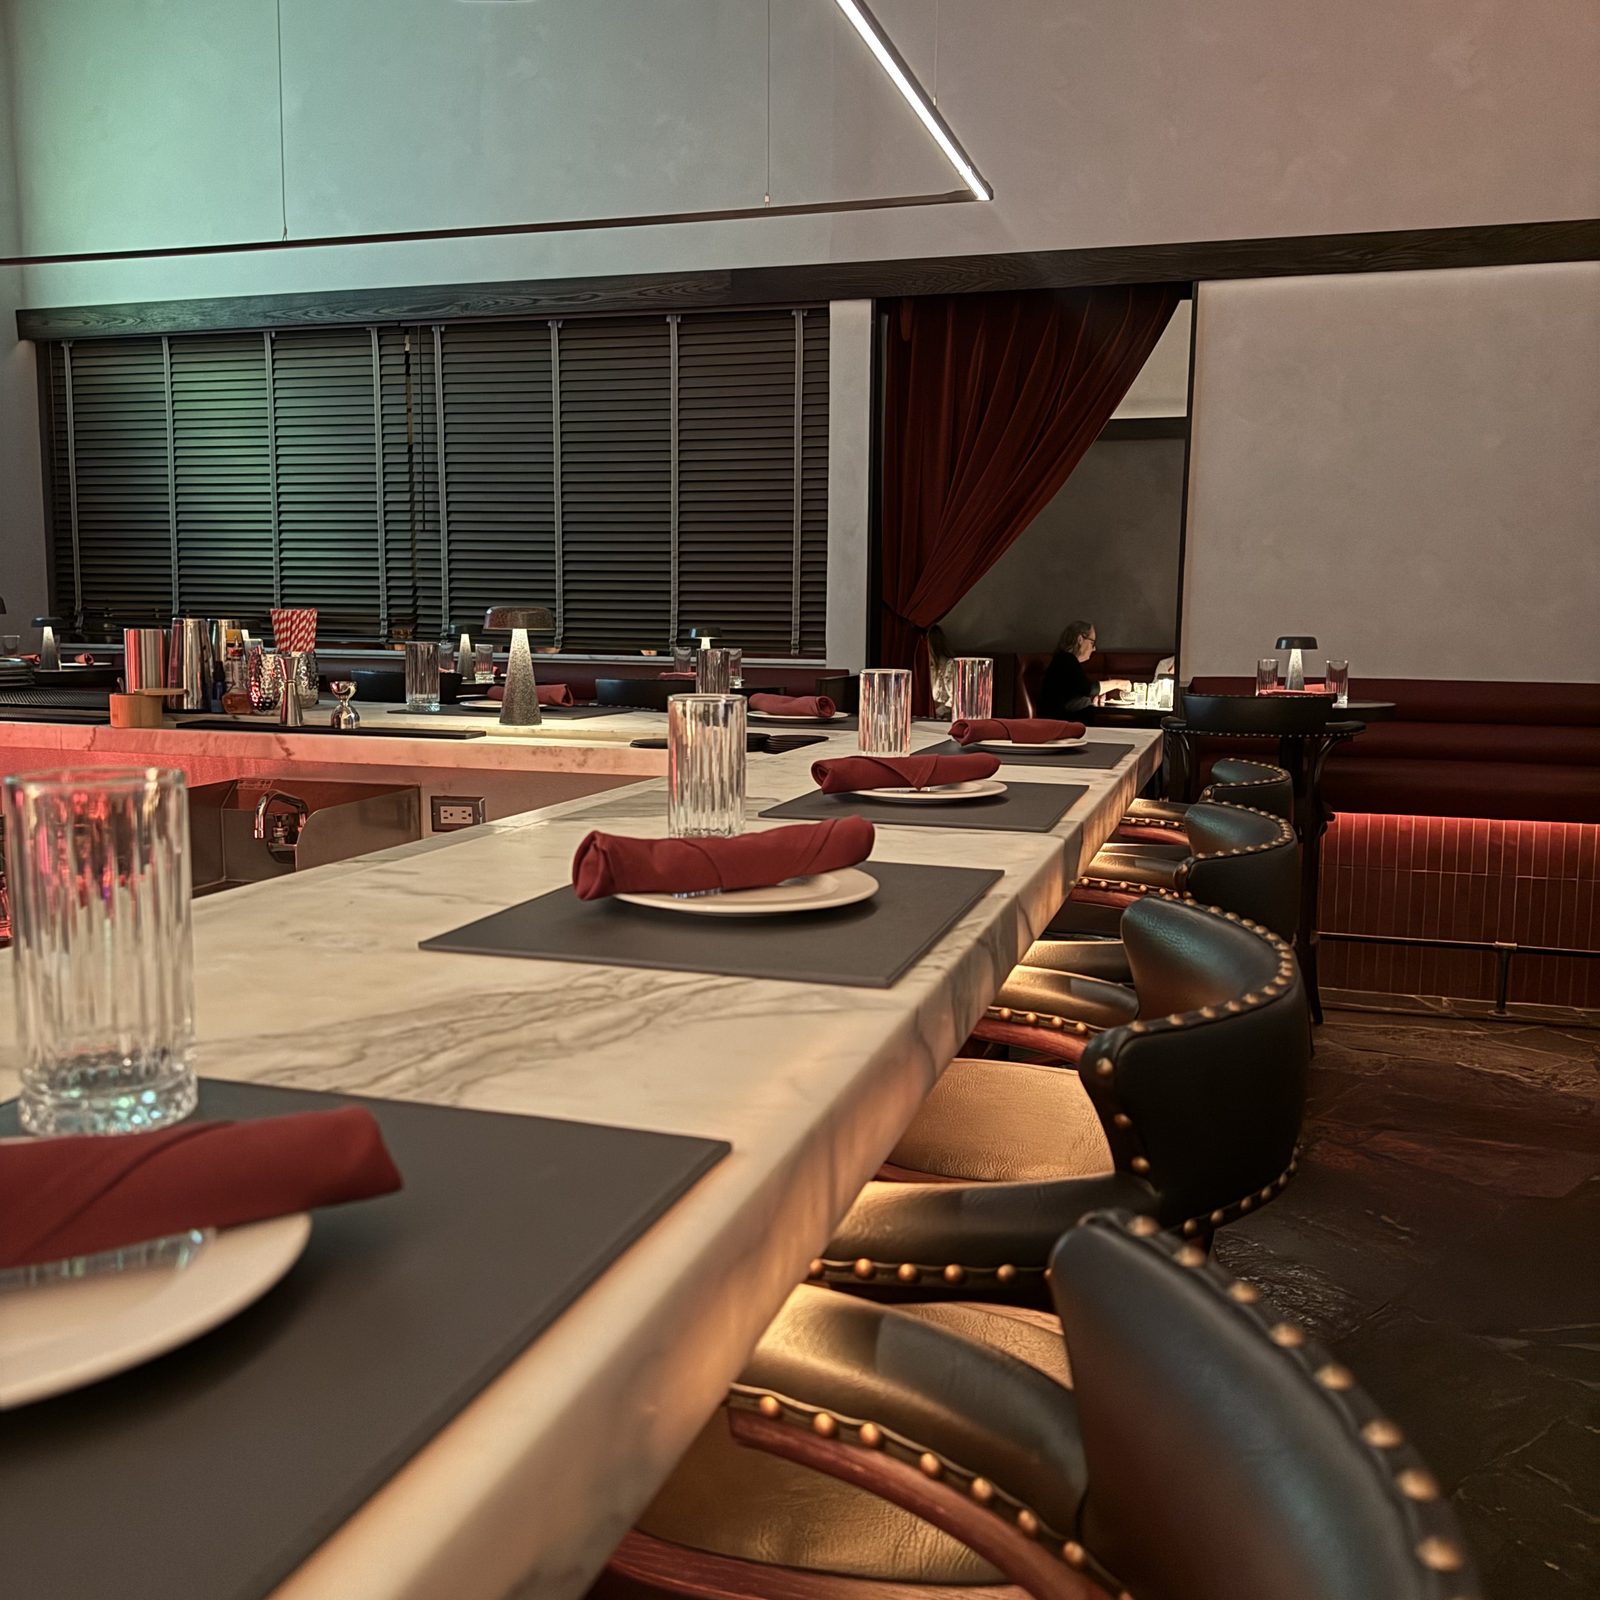
The register snapshot used here is dated 1 July 2026, and the county, which refreshes it quarterly, describes it as covering active and newly established businesses. Anything that opened after 1 July is missing. A restaurant that has closed can stay on the register until its permit lapses or the owner surrenders it, which is why Here’s Looking at You, photographed above, is closed and still listed. Permits that outlive their restaurants push the count up, and we haven’t estimated by how much.
The county’s “restaurant” category covers any permitted seated food service, which takes in coffee and donut shops, bar kitchens, hotel dining rooms and stadium concessions, along with about 180 institutional kitchens across the county. Nothing in the register picks out sit-down dinner houses, so this count can’t separate them either. Seating is recorded in bands, and 6,617 of the city’s restaurants, 57 percent, have 30 seats or fewer.
Restaurants are placed in neighborhoods by their coordinates. The mailing address would miss about 4,000 of them, because North Hollywood, Van Nuys, San Pedro, Canoga Park, Encino and a dozen other places inside the City of Los Angeles have their own postal names, and filtering the register on the city name LOS ANGELES returns only 7,516 facilities.
Each facility counts once, however many permits it holds. SoFi Stadium has 121 restaurant permits and Dodger Stadium 73. Another 45 records across the county have no usable coordinates and are left out.
The register records seats, ownership and address but says nothing about the food, so there’s no way to tell from it which neighborhood eats what.
Boundaries are Mapping L.A.’s 114 neighborhoods, covering the City of Los Angeles only. Downtown here is a single unit absorbing the Arts District, Little Tokyo, the Historic Core and the Fashion District. Unincorporated county and the other 87 cities are out of frame. The county register also excludes Long Beach, Pasadena and Vernon, which run their own health departments. None of the three is in the City of Los Angeles, so the city count isn’t affected.
Sources: LA County Department of Public Health, Environmental Health Restaurant and Market Inventory, snapshot 1 July 2026, retrieved 13 August 2026. Income is ACS 2020-2024 table B19013, tract-level median household income, population-weighted to a neighborhood figure; the quartile table averages those neighborhood figures. The first version’s counts came from OpenStreetMap. Our thanks to the reader who sent us to the right file.