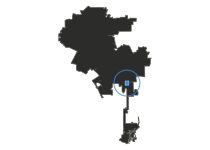
0.16
Park acres per 1,000
Citywide 4.2185th of 109
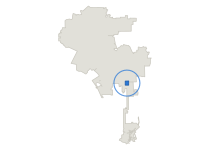
Vermont-Slauson has 11.7 permitted restaurants per 10,000 residents, compared with 30.1 citywide.
All 114 neighborhoods By council district instead
Population, density and the kinds of homes people live in.
Boundaries are the Mapping L.A. neighborhood set. Population and every demographic figure is the U.S. Census Bureau's American Community Survey 2020-2024 five-year tract estimate, apportioned to neighborhood lines by area from the same 2,495 county tracts every other Basin geography is built from.
Median rent, renter income and the share of income that rent takes. These figures describe renter households rather than the neighborhood as a whole.
U.S. Census Bureau American Community Survey 2020-2024 five-year estimates, tables B25063 gross rent, B25118 household income by tenure and B25070 rent as a share of income, apportioned to neighborhood lines by area. Rents and incomes are interpolated once from the pooled bin counts rather than averaged from tract medians, because a median is a rank and cannot be averaged.
How much park land the neighborhood holds, and how close people live to it. Acreage and proximity are separate measures.
City of Los Angeles Department of Recreation and Parks park boundaries, GeoHub layer LA_City_Parks_Boundaries, last modified 2025-08-18, retrieved 2026-08-13. Acreage is a geometric union, not a sum of polygons.
What Metro runs here, and how much of the neighborhood is within walking distance of it.
LA Metro GTFS rail and bus schedule feeds, retrieved 2026-08-13 for the service window beginning that day.
Income-restricted, federally assisted and newly permitted housing. Three separate counts that should not be added together.
Los Angeles Housing Department affordable-housing inventory, the federal Multifamily Assistance and Section 8 contract database, and Los Angeles Department of Building and Safety issued permits for 2020-01-01 to 2026-08-10. Every site placed by its own coordinates.
Permitted restaurants, counted at the address where each one stands.
Los Angeles County Department of Public Health Environmental Health restaurant and market inventory, snapshot 2026-07-01, retrieved 2026-08-13. Every facility placed by its own coordinates rather than by the city name on its record.
The nine serious offense categories in 2023, the last full year before the department changed how it counts.
Los Angeles Police Department incident records, reclassified onto one consistent Part I offense hierarchy by The Basin and apportioned from reporting districts to neighborhoods by area share.
What the property here is worth for tax purposes. The tax is levied on owners, who are not identified on the roll and do not necessarily live here.
Los Angeles County Assessor annual assessment roll for 2025, every parcel placed in a neighborhood by its own coordinates.
The neighborhoods that share a boundary with Vermont-Slauson, longest border first.
Vermont Knolls, Vermont Square, Harvard Park, Florence, South Park.
Every figure here is computed from a public record and can be recomputed from the same file. Where the neighborhood's figure is a rate, the citywide figure beside it is the whole city's numerator over the whole city's denominator rather than an average of 114 rates, because those two are not the same number. Rank: 1 = highest value among the 114 neighborhoods.
The boundaries are the Mapping L.A. neighborhood set, 114 of them, covering 99.9% of the city's residents. They are not council districts, they are not neighborhood councils, and they have no government: they are the names people use. Every figure is built from the same 2,495 census tracts as the council-district pages, which is why the two sets of pages reconcile against each other.
Rates are withheld for the five units below 4,000 residents, which are a dam, a reservoir, two parks and a flood basin. Counts are shown for all 114.
Reported crime is apportioned to these boundaries by area share. Two in five police reporting districts straddle a neighborhood line, against fewer than one in five at council-district scale, so no figure here is a tally of reports filed under one neighborhood's name. The population behind those rates is one census estimate applied to every year, so they compare places and never time.
The data behind this page is published at Basin Data. Corrections go to data@basin.la and we will recompute from the source either way.