Your Government Licensing & data
The Basin
Data journalism from the Los Angeles Basin
Neighborhoods

Carthay

4,895 residentsmostly in Council District 5

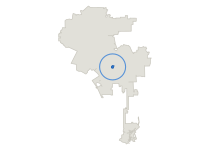
Where Carthay sits in the city of Los Angeles
0.20
Park acres per 1,000
Citywide 4.2183rd of 109
0
Metro rail stations
Citywide 5731st of 114
53.1
Restaurants per 10,000
Citywide 30.114th of 109
0.00
Affordable per 1,000
Citywide 8.7677th of 109
32.9
Offenses per 1,000
Citywide 36.551st of 109

Carthay has 4,895 residents. Restaurants run 53.1, against 30.1 citywide.

All 114 neighborhoods By council district instead

Who lives here

How many people, in how much space, in what kind of home.

Measure
This neighborhood
Citywide
Rankmost to least
Homes that are rented
Share of occupied homes with a renter in them.
55.0%
64.0%
67th of 109
Neighborhood figures are apportioned from census tracts by area, so a tract split by a boundary contributes in proportion to its area.
Median household income
Median of the tract medians, weighted by households.
$114,460
$90,763
31st of 109
A median of tract medians is an estimate of a median and not the median itself, which is not published at this geography.
Residents per square mile
Population over land area, excluding water.
9,740
8,221
66th of 109
Residents with a bachelor's degree or more
Share of residents aged 25 and over.
64.0%
38.4%
26th of 109

Boundaries are the Mapping L.A. neighborhood set. Population and every demographic figure is the U.S. Census Bureau's American Community Survey 2020-2024 five-year tract estimate, apportioned to neighborhood lines by area from the same 2,495 county tracts every other Basin geography is built from.

Parks and open space

How much park land the neighborhood holds, and how close people live to it. The two answers are not the same.

Measure
This neighborhood
Citywide
Rankmost to least
City park land per 1,000 residents
1.0 acres here. Recreation and Parks land only, measured as a geometric union.
0.20
4.21
83rd of 109
Neighborhood figures are apportioned from census tracts by area, so a tract split by a boundary contributes in proportion to its area.
City park sites
Distinct Recreation and Parks sites touching the neighborhood.
1
536
93rd of 114
A park straddling a boundary is counted in both neighborhoods, so these do not add to the citywide total.
Residents within half a mile of an open park
Straight-line half mile to any open-access park, any agency.
94.7%
75.9%
30th of 109
Straight line rather than a street-network walk, so it is an upper bound on how many people can really walk there.

City of Los Angeles Department of Recreation and Parks park boundaries, GeoHub layer LA_City_Parks_Boundaries, last modified 2025-08-18, retrieved 2026-08-13. Acreage is a geometric union, not a sum of polygons.

Getting around

What Metro runs here, and how much of the neighborhood is within walking distance of it.

Measure
This neighborhood
Citywide
Rankmost to least
Metro rail stations
Stations inside the neighborhood, all Metro rail lines.
0
57
31st of 114
Bus stops per 10,000 residents
16 stops here. Metro bus stops with weekday service.
32.7
18.0
5th of 109
Stops, not service. A stop served twice an hour and a stop served twice a day count the same here.
Residents within a quarter mile of a bus stop
Straight-line quarter mile to a Metro bus stop with weekday service.
95.1%
77.5%
36th of 109

LA Metro GTFS rail and bus schedule feeds, retrieved 2026-08-13 for the service window beginning that day.

Homes

What is income restricted, what is federally assisted and what has been permitted. Three different things that are never added together.

Measure
This neighborhood
Citywide
Rankmost to least
Income-restricted homes per 1,000 residents
0 homes here. Covenanted affordable units in the Housing Department inventory.
0.00
8.76
77th of 109
Covenanted and federally assisted units are two different things that overlap by an unpublished amount. They are never added together.
Net homes permitted since 2020
Units added minus units removed on issued building permits.
483
75,381
44th of 114
A permit is not a finished home. These are permits issued, not certificates of occupancy.
Federally assisted properties
Distinct properties on an active or expired federal contract.
0
363
79th of 114
Counted by property rather than by contract: 415 contracts sit on 363 buildings citywide.

Los Angeles Housing Department affordable-housing inventory, the federal Multifamily Assistance and Section 8 contract database, and Los Angeles Department of Building and Safety issued permits for 2020-01-01 to 2026-08-10. Every site placed by its own coordinates.

The rent-stabilized inventory is not on this page. The Housing Department publishes it by ZIP code and by council district and by nothing finer, and a ZIP code does not sit inside a neighborhood, so any neighborhood figure would be a split we invented rather than one anybody measured. Most of this neighborhood sits in Council District 5, which carries it.

Eating out

Every permitted restaurant in the neighborhood, counted where it stands.

Measure
This neighborhood
Citywide
Rankmost to least
Restaurants per 10,000 residents
26 restaurants here. Permitted restaurants in the county health inventory.
53.1
30.1
14th of 109
A restaurant is counted where it stands, not where its customers live, so a neighborhood people travel to for dinner rates higher than one they travel from.
Restaurants that are not chains
24 of 26 here. Share of the neighborhood's restaurants outside a recognized chain.
92.3%
85.7%
15th of 94
Reported for neighborhoods with at least twenty restaurants. Below that a single opening moves the share by several points.

Los Angeles County Department of Public Health Environmental Health restaurant and market inventory, snapshot 2026-07-01, retrieved 2026-08-13. Every facility placed by its own coordinates rather than by the city name on its record.

Reported crime

The nine serious offense categories in 2023, the last full year before the department changed how it counts.

Measure
This neighborhood
Citywide
Rankmost to least
Reported serious offenses per 1,000 residents, 2023
161 offenses here. Nine Part I offense categories, apportioned by area share.
32.9
36.5
51st of 109
The denominator counts residents and the numerator does not. Crime is recorded where it happens, and a neighborhood holding downtown, a stadium, an airport or a transit hub carries offenses committed against people who do not live there. This matters more here than at district scale, where those places are diluted across a quarter of a million residents.
Reported violent offenses per 1,000 residents, 2023
27 offenses here. Homicide, rape, robbery and aggravated assault.
5.5
8.0
56th of 109
Two in five police reporting districts straddle a neighborhood line, against fewer than one in five at council-district scale, so these counts are apportioned by area share and are not a tally of reports filed under one name.

Los Angeles Police Department incident records, reclassified onto one consistent Part I offense hierarchy by The Basin and apportioned from reporting districts to neighborhoods by area share.

Property and the tax base

What the property here is worth for tax purposes. The tax is levied on owners, who are not identified on the roll and do not necessarily live here.

Measure
This neighborhood
Citywide
Rankmost to least
Net taxable property value
2025 assessment roll, every parcel placed by its own coordinates.
$2,094,587,917
$834,825,925,731
91st of 114
The tax is levied on the owner of record. The roll does not identify owners, and they do not necessarily live in the neighborhood. Nothing here says a neighborhood paid anything.
Net taxable value per parcel
1,254 parcels here. Assessed value, which is not market value: Proposition 13 holds it near the last sale price.
$1,670,325
$1,039,271
20th of 112
Two identical houses can be assessed decades apart, so this tracks when property last changed hands as much as what it is worth.

Los Angeles County Assessor annual assessment roll for 2025, every parcel placed in a neighborhood by its own coordinates.

How this page is built

Every figure here is computed from a public record and can be recomputed from the same file. Where the neighborhood's figure is a rate, the citywide figure beside it is the whole city's numerator over the whole city's denominator rather than an average of 114 rates, because those two are not the same number. Rank runs from most to least and is a position, not a verdict.

The boundaries are the Mapping L.A. neighborhood set, 114 of them, covering 99.9% of the city's residents. They are not council districts, they are not neighborhood councils, and they have no government: they are the names people use. Every figure is built from the same 2,495 census tracts as the council-district pages, which is why the two sets of pages reconcile against each other.

Rates are withheld for the five units below 4,000 residents, which are a dam, a reservoir, two parks and a flood basin. Counts are shown for all 114.

Reported crime is apportioned to these boundaries by area share. Two in five police reporting districts straddle a neighborhood line, against fewer than one in five at council-district scale, so no figure here is a tally of reports filed under one neighborhood's name. The population behind those rates is one census estimate applied to every year, so they compare places and never time.

The data behind this page is published at Basin Data. Corrections go to data@basin.la and we will recompute from the source either way.